Page 1 of 1

Failure visualized

Posted: Thu Apr 17, 2008 2:49 am
by THE DINJ
It ain't pretty:
Image

Image

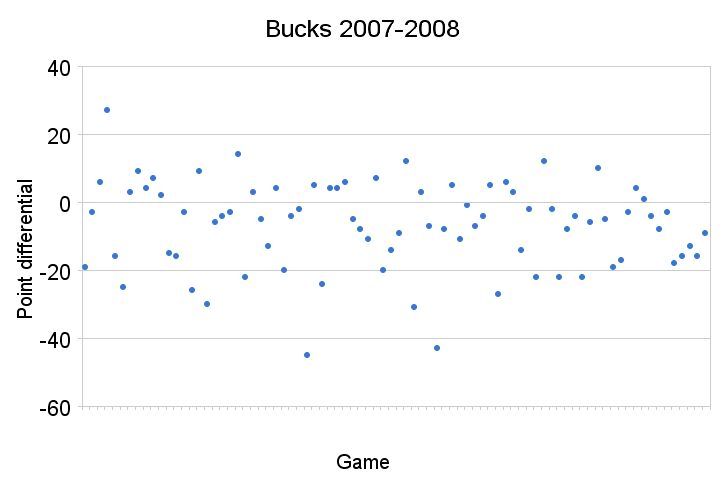
Average points for: 97.0243902439024
Average points against: 103.914634146341
Average differential: -6.89024390243902

Posted: Thu Apr 17, 2008 2:54 am
by paulpressey25
Those graphs are really good......

It is amazing how few seasons we've had under Kohl where the team actually came together after the start of the new year and played better. Every year we hang near .500 right up to Christmas......then the roof caves in.

Posted: Thu Apr 17, 2008 2:39 pm
by Neapolitan Buck
Those graphs are depressing.