The chart:
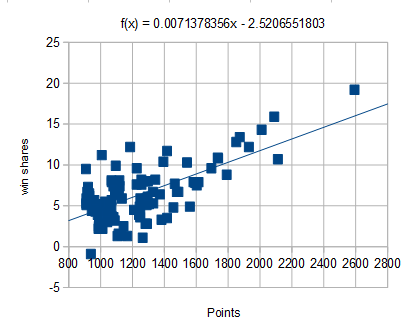
I then found the player's projected win shares (based on points and the graph's trendline) and looked at the players who most under or over achieved their win share projection. Perhaps unsurprisingly, high scorers on bad teams top the list. The top stat (or points anyways) stuffer: Tony Wroten!
Leading Stuffers - (most underachieved projection)
1. Tony Wroten -121.52%
2. Josh Smith -83.08%
3. Michael Carter -77.62%
4. Victor Oladipo -75.81%
5. Evan Turner -74.785
6. Dion Waiters -70.5%
7. Brandon Knight -58.17%
8. Jamal Crawford -57.77%
9. Nick Young -55.71%
10. Jeff Green -55.06%
Leading Anti-Stuffers (most overachieved projection)
1. Joakim Noah +139.98%
2. Robin Lopez +139.87%
3. Chris Paul +105.47%
4. Andre Drummond +86.96%
5. Terrence Jones +80.1%
6. Jonas Valanciunas +66.77
7. Marcin Gortat +58.74%
8. Mike Dunleavy +58.14%
9. Nicolas Batum +54.39%
10. Jose Calderon +54.34%
What do you think? Let me know if I committed any mathematical heresies. If I wanted to do all "all box score stats" comparison, what should I use instead of just points?
Kevin Love BTW, +20.9% over his projection (31st best of the 103).


