I've compiled some extensive head to head comparisons for Bird, Erving, Aguirre, Dantley, English, Johnson, King, Wilkins, and Worthy, keeping games in seasons where both players averaged at least 27 MPG. I know that head-to-head matchups aren't the best way of evaluating players, but I thought it would make for an interesting comparison to see how the high-scoring duels panned out overall.
A full set of spreadsheets with yearly comparisons of each player against all of the others collectively, as well as the 36 individual player vs. player matchups
here.
Below I'll post the summaries for each player against all of the others collectively. TS values with asterisks imply that up to half of the games in that season have missing statistics.
The column "Vs. Exp" is a comparison of team margin vs. SRS expectations, taking into account homecourt advantage. Each of the columns labelled "Rel" indicate difference from season averages of the previous column.
Larry Bird:
As expected, Bird enjoyed great team success against the competition, sporting a .605 winning percentage. He outscored his opponents by about a point on TS 2% better than his opponents (since 1982), and had massive advantages in rebounds and assists, as you would expect. Interestingly, both his TS and his opponents' TS dropped by more than 2% from their respective averages.
Code: Select all
Player   Year    W   L Vs. Exp  PPG    Rel   RPG   Rel   APG   Rel    TS      Rel
Bird     1980   11   7  -0.62  22.78  +1.50   NA    NA    NA    NA     NA      NA
Top SFs  1980    7  11  +0.62  26.00  +1.85   NA    NA    NA    NA     NA      NA
Bird     1981   14  10  -0.08  23.13  +1.89   NA    NA    NA    NA     NA      NA
Top SFs  1981   10  14  +0.08  24.38  +0.49   NA    NA    NA    NA     NA      NA
Bird     1982   13   9  +2.22  21.09  -1.78   NA    NA    NA    NA   .4644* -.0925
Top SFs  1982    9  13  -2.22  22.18  -1.34   NA    NA    NA    NA   .5470* -.0425
Bird     1983   19  13  +1.60  23.38  -0.26   NA    NA    NA    NA   .5412  -.0194
Top SFs  1983   13  19  -1.60  20.19  -1.11   NA    NA    NA    NA   .5145  -.0361
Bird     1984   29  18  -0.97  24.49  +0.34   NA    NA    NA    NA   .5533  +.0010
Top SFs  1984   18  29  +0.97  23.04  +0.97   NA    NA    NA    NA   .5511  -.0253
Bird     1985   23  11  +0.51  27.29  -1.39   NA    NA    NA    NA   .5731  -.0121
Top SFs  1985   11  23  -0.51  22.97  +0.14   NA    NA    NA    NA   .5265  -.0320
Bird     1986   22   4  +0.57  25.54  -0.25  9.88 +0.07  7.23 +0.44  .5735  -.0068
Top SFs  1986    4  22  -0.57  25.19  -0.38  5.54 -0.81  3.38 +0.25  .5349  -.0196
Bird     1987   18  15  -0.98  26.09  -1.96  9.30 +0.09  7.64 -0.01  .5831  -.0285
Top SFs  1987   15  18  +0.98  23.97  +1.81  4.24 -0.79  3.03 +0.23  .5638  -.0058
Bird     1988   19  16  -1.11  26.34  -3.59  8.89 -0.36  6.06 -0.09  .5722  -.0356
Top SFs  1988   16  19  +1.11  22.43  -1.41  4.11 -0.67  2.66 -0.27  .5297  -.0287
Bird     1989    0   1  -9.61  24.00  +4.67 10.00 +3.83  6.00 +1.17  .6682  +.1520
Top SFs  1989    1   0  +9.61  31.00 +12.62  4.00 +0.10  5.00 +2.79  .7033  +.0898
Bird     1990    5   7  -1.44  23.92  -0.35 10.58 +1.09  6.50 -0.99  .5383  -.0072
Top SFs  1990    7   5  +1.44  21.92  -0.95  3.25 -2.15  2.92 -0.51  .5119  -.0398
Bird     1991    4   3  +1.16  15.29  -4.11  7.86 -0.63  7.71 +0.53  .4646  -.0657
Top SFs  1991    3   4  -1.16  20.14  -5.85  5.71 -1.53  2.29 -1.39  .5029  -.0390
Bird     1992    1   2  -8.98  16.67  -3.51  7.67 -1.98  6.00 -0.80  .4941  -.0534
Top SFs  1992    2   1  +8.98  28.00  +2.65  5.67 -0.90  4.00 -0.06  .5271  -.0032
Bird     Total 178 116  -0.15  24.39  -0.82  9.32 -0.01  6.91 -0.01  .5560  -.0209
Top SFs  Total 116 178  +0.15  23.13  -0.00  4.51 -0.94  2.98 -0.07  .5368  -.0260
:
I was a little surprised that Dr. J ended up on the wrong end of the scoring comparison on nearly identical efficiency to his opponents. Still, the bulk of the data came as he was winding down his career, with rebounding, assist and TS stats only available from 1982 onward. Still, his teams enjoyed the third best winning percentage among the 9 players considered here.
Code: Select all
Player   Year    W   L Vs. Exp  PPG    Rel  RPG   Rel   APG   Rel     TS    Rel
Erving   1977    1   2  -9.35  14.67 -6.92   NA    NA    NA    NA     NA     NA
Top SFs  1977    2   1  +9.35  19.00 -1.31   NA    NA    NA    NA     NA     NA
Erving   1978    6   4  +0.25  19.40 -1.25   NA    NA    NA    NA     NA     NA
Top SFs  1978    4   6  -0.25  23.40 +1.84   NA    NA    NA    NA     NA     NA
Erving   1979    8   7  -2.90  23.07 -0.05   NA    NA    NA    NA     NA     NA
Top SFs  1979    7   8  +2.90  22.07 +1.73   NA    NA    NA    NA     NA     NA
Erving   1980   13   5  +1.89  27.17 +0.24   NA    NA    NA    NA     NA     NA
Top SFs  1980    5  13  -1.89  21.06 +0.04   NA    NA    NA    NA     NA     NA
Erving   1981   17  14  -0.49  23.94 -0.63   NA    NA    NA    NA     NA     NA
Top SFs  1981   14  17  +0.49  26.06 +4.39   NA    NA    NA    NA     NA     NA
Erving   1982   16  14  -0.05  23.10 -1.27  7.33 +0.46  4.83 +0.90  .5964 +.0037
Top SFs  1982   14  16  +0.05  19.53 -1.69  9.37 +1.16  4.53 -0.14  .5095 -.0620
Erving   1983   24   7  +2.10  19.61 -1.80  7.29 +0.47  3.48 -0.17  .5339 -.0324
Top SFs  1983    7  24  -2.10  21.81 -0.11  7.42 +0.62  3.39 -0.38  .5231 -.0274
Erving   1984   16  13  +1.28  21.48 -0.95  7.21 +0.30  3.86 -0.15  .5331 -.0289
Top SFs  1984   13  16  -1.28  23.69 -0.11  7.17 +0.22  3.79 -0.04  .5300 -.0357
Erving   1985   14  11  +0.67  18.00 -2.01  5.32 +0.01  3.40 +0.41  .5208 -.0248
Top SFs  1985   11  14  -0.67  28.12 +0.68  7.20 -0.67  4.36 -0.25  .5754 +.0039
Erving   1986    8  10  -1.95  16.06 -2.05  5.39 +0.39  4.17 +0.82  .4936 -.0437
Top SFs  1986   10   8  +1.95  25.61 -1.13  8.06 +0.46  5.17 +0.70  .5320 -.0332
Erving   1987    6   9  -2.08  15.27 -1.48  4.80 +0.40  3.93 +0.75  .4688 -.0583
Top SFs  1987    9   6  +2.08  23.60 -1.60  5.47 -0.83  5.33 +0.88  .5385 -.0426
Erving   Total 129  96  +0.00  20.92 -1.24  6.47 +0.34  3.95 +0.36  .5348 -.0262
Top SFs  Total  96 129  -0.00  23.45 +0.41  7.61 +0.27  4.28 +0.02  .5347 -.0316
:
Aguirre has a scoring edge over his opponents on slightly worse efficiency, and is neck and neck in both rebounding and assists since 1986. His teams didn't do so hot, though, with a 0.437 winning percentage (only posting winning records against these opponents twice) and an average performance of 0.52 points worse than SRS expectations.
Code: Select all
Player   Year    W   L Vs. Exp  PPG    Rel  RPG   Rel   APG    Rel     TS     Rel
Aguirre  1982    3   9  -0.04  24.58 +5.86   NA   NA     NA    NA     NA      NA
Top SFs  1982    9   3  +0.04  28.75 +1.85   NA   NA     NA    NA     NA      NA
Aguirre  1983    4  12  -1.87  26.31 +1.88   NA   NA     NA    NA   .5322* -.0032
Top SFs  1983   12   4  +1.87  25.56 +1.14   NA   NA     NA    NA   .5580* +.0018
Aguirre  1984   13  17  -0.57  27.73 -1.76   NA   NA     NA    NA   .5587  -.0129
Top SFs  1984   17  13  +0.57  23.67 +1.66   NA   NA     NA    NA   .5964  +.0093
Aguirre  1985   10  16  -4.23  27.54 +1.85   NA   NA     NA    NA   .5681  +.0048
Top SFs  1985   16  10  +4.23  21.77 -1.79   NA   NA     NA    NA   .5408  -.0209
Aguirre  1986   13  17  -0.11  21.43 -1.13  5.73 -0.28  4.77 +0.19  .5205  -.0269
Top SFs  1986   17  13  +0.11  23.00 -1.08  5.60 +0.07  3.70 +0.31  .5699  -.0123
Aguirre  1987   10   9  -0.01  26.84 +1.14  4.26 -1.07  2.84 -0.33  .5651  +.0049
Top SFs  1987    9  10  +0.01  23.11 -1.06  6.26 +1.04  3.37 -0.64  .5435  -.0175
Aguirre  1988   13  17  +0.41  25.00 -0.09  5.63 -0.00  3.60 -0.01  .5541  +.0152
Top SFs  1988   17  13  -0.41  23.73 +0.82  4.97 -0.11  4.33 +0.24  .5511  -.0063
Aguirre  1989   14   6  +2.70  15.55 -2.41  4.55 -0.10  3.70 +0.50  .5239  -.0026
Top SFs  1989    6  14  -2.70  18.50 -4.26  4.05 -1.25  3.45 -0.14  .4933  -.0592
Aguirre  Total  80 103  -0.52  24.47 +0.18  5.18 -0.31  3.83 +0.09  .5487  -.0033
Top SFs  Total 103  80  +0.52  23.17 -0.38  5.22 -0.07  3.78 +0.02  .5541  -.0131
:
As you might expect, Dantley has the largest scoring margin of the 9 players considered here, outgunning his opponents by over 3 PPG on nearly 8% better TS. Team success in Utah was predictably poor (particularly 1985 and 1986), though not relative to SRS expectations. In fact, his teams tended to outperform their SRS expectations against this set of opponents. Most surprising may be that his opponents' scoring average was more than a point less than their respective season averages overall, and while his time in Detroit did contribute to that, his opponents weren't going crazy on him in Utah, even prior to the Jazz becoming good on defense in 1983. He loses out on rebounds and assists, though I imagine this is somewhat distorted by the fact the data is mostly available after he assumed a reduced role in Detroit and Dallas.
Code: Select all
Player   Year    W   L Vs. Exp  PPG    Rel  RPG   Rel   APG   Rel     TS     Rel
Dantley  1977    2   1  +9.35  19.00 -1.31   NA    NA    NA    NA     NA      NA
Top SFs  1977    1   2  -9.35  14.67 -6.92   NA    NA    NA    NA     NA      NA
Dantley  1978    8   3  +0.86  21.64 +0.29   NA    NA    NA    NA     NA      NA
Top SFs  1978    3   8  -0.86  18.82 -2.47   NA    NA    NA    NA     NA      NA
Dantley  1979    9   4  +3.69  20.92 +3.59   NA    NA    NA    NA     NA      NA
Top SFs  1979    4   9  -3.69  18.08 -2.96   NA    NA    NA    NA     NA      NA
Dantley  1980    4   7  +0.88  27.82 -0.17   NA    NA    NA    NA     NA      NA
Top SFs  1980    7   4  -0.88  21.91 +0.57   NA    NA    NA    NA     NA      NA
Dantley  1981    6  10  +3.14  34.69 +4.04   NA    NA    NA    NA     NA      NA
Top SFs  1981   10   6  -3.14  21.44 -1.22   NA    NA    NA    NA     NA      NA
Dantley  1982    8  14  +0.36  33.36 +3.03   NA    NA    NA    NA     NA      NA
Top SFs  1982   14   8  -0.36  23.45 +1.21   NA    NA    NA    NA     NA      NA
Dantley  1983    2   3  -4.60  32.40 +1.67   NA    NA    NA    NA   .7066* +.0453
Top SFs  1983    3   2  +4.60  26.80 +2.86   NA    NA    NA    NA   .5618* +.0052
Dantley  1984   12  18  -2.63  31.13 +0.53   NA    NA    NA    NA   .6495  -.0025
Top SFs  1984   18  12  +2.63  24.07 +0.17   NA    NA    NA    NA   .5593  -.0108
Dantley  1985    8  16  +0.45  25.21 -1.37   NA    NA    NA    NA   .6092  +.0019
Top SFs  1985   16   8  -0.45  24.42 -0.32   NA    NA    NA    NA   .5601  +.0019
Dantley  1986    5  17  -0.68  29.18 -0.65  6.00 +0.80  3.82 +0.34  .6256  -.0030
Top SFs  1986   17   5  +0.68  20.95 -2.28  5.82 -0.09  3.73 -0.20  .5434  -.0221
Dantley  1987   18  13  +5.17  20.68 -0.83  4.29 +0.19  2.03 +0.03  .6055  -.0087
Top SFs  1987   13  18  -5.17  24.29 -1.57  7.03 +0.35  4.52 -0.24  .5360  -.0313
Dantley  1988   19  17  +0.08  20.00 +0.00  3.69 +0.40  2.06 -0.42  .6187  -.0003
Top SFs  1988   17  19  -0.08  22.00 -2.38  6.94 +0.56  4.36 +0.06  .5432  -.0284
Dantley  1989   11   6  +5.00  19.53 +0.38  3.71 -0.62  1.82 -0.52  .6050  +.0243
Top SFs  1989    6  11  -5.00  21.00 -1.63  6.12 +0.51  3.00 -0.49  .5164  -.0211
Dantley  1990    3   4  +1.63  18.57 +3.86  4.29 +0.46  1.00 -0.78  .6088  +.0532
Top SFs  1990    4   3  -1.63  20.29 -1.07  5.43 +0.36  4.43 +0.93  .5136  -.0382
Dantley  Total 115 133  +1.24  25.52 +0.64  4.35 +0.27  2.29 -0.18  .6245  +.0033
Top SFs  Total 133 115  -1.24  22.31 -1.13  6.53 +0.36  4.08 -0.10  .5458  -.0179
:
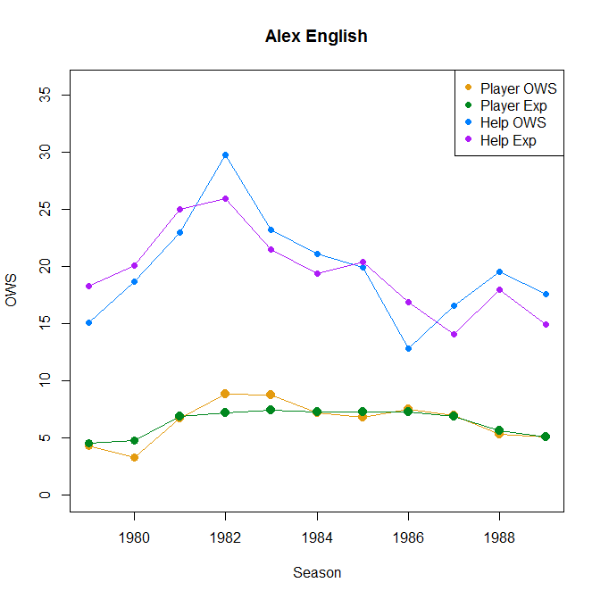
English's scoring is right on par with that of his opponents, but on 5% worse efficiency. I imagine a lot of that can be chalked up to Denver's poor team defense throughout his time there. Like Erving and Dantley, his rebounding and playmaking abilities are probably undersold by the totals, although he enjoys an edge in assists even in his later years. Team success was quite variable, with 1985 shining as expected, but 1987 looking particularly troublesome.
Code: Select all
Player   Year    W   L Vs. Exp  PPG    Rel  RPG   Rel   APG   Rel     TS    Rel
English  1979    5  10  +0.29  14.80 -1.24   NA    NA    NA    NA     NA     NA
Top SFs  1979   10   5  -0.29  21.27 -0.66   NA    NA    NA    NA     NA     NA
English  1980    2  10  -1.80  13.17 -2.83   NA    NA    NA    NA     NA     NA
Top SFs  1980   10   2  +1.80  23.75 -0.60   NA    NA    NA    NA     NA     NA
English  1981    7  10  -0.87  22.00 -1.81   NA    NA    NA    NA     NA     NA
Top SFs  1981   10   7  +0.87  29.82 +4.80   NA    NA    NA    NA     NA     NA
English  1982   12   9  -1.04  26.14 +0.75   NA    NA    NA    NA     NA     NA
Top SFs  1982    9  12  +1.04  30.43 +6.60   NA    NA    NA    NA     NA     NA
English  1983    6  10  +0.08  27.94 -0.43   NA    NA    NA    NA   .5331 -.0281
Top SFs  1983   10   6  -0.08  24.56 +1.62   NA    NA    NA    NA   .5754 +.0232
English  1984   13  19  +0.44  26.88 +0.45   NA    NA    NA    NA   .5713 +.0016
Top SFs  1984   19  13  -0.44  27.63 +2.11   NA    NA    NA    NA   .6273 +.0274
English  1985   22  16  +0.26  27.92 -0.00   NA    NA    NA    NA   .5743 +.0131
Top SFs  1985   16  22  -0.26  22.47 -0.48   NA    NA    NA    NA   .5983 +.0273
English  1986   14  10  +2.42  28.63 -1.18  4.63 -0.38  4.13 +0.17  .5399 -.0218
Top SFs  1986   10  14  -2.42  23.04 -0.47  7.00 +0.96  3.63 -0.18  .5722 -.0059
English  1987    2  18  -8.07  27.35 -1.25  3.80 -0.40  3.80 -1.35  .5493 -.0001
Top SFs  1987   18   2  +8.07  25.05 +2.27  5.45 -0.14  3.65 +0.52  .6394 +.0701
English  1988   13  10  -0.80  26.00 +1.00  4.78 +0.12  4.61 -0.10  .5374 +.0028
Top SFs  1988   10  13  +0.80  22.13 -1.81  5.74 +0.17  3.52 -0.12  .5757 +.0187
English  1989    6   8  -2.06  23.79 -2.74  4.29 +0.31  4.86 +0.19  .4797 -.0514
Top SFs  1989    8   6  +2.06  24.07 +3.65  6.14 +0.80  4.64 +1.29  .5658 +.0204
English  1990    4   8  -2.26  16.00 -1.91  3.25 -0.33  2.92 +0.10  .4737 -.0480
Top SFs  1990    8   4  +2.26  21.83 +0.13  8.17 +2.05  4.08 +0.16  .5944 +.0349
English  Total 106 138  -0.85  24.70 -0.62  4.26 -0.15  4.13 -0.23  .5458 -.0082
Top SFs  Total 138 106  +0.85  24.77 +1.33  6.38 +0.65  3.82 +0.25  .5982 +.0269
:
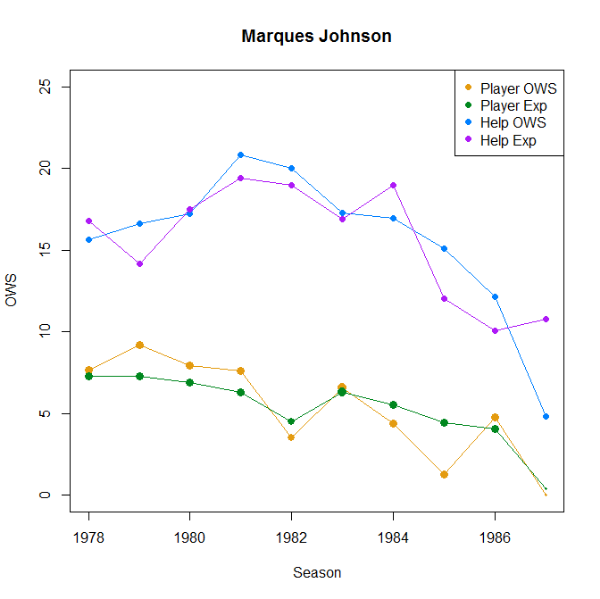
Known as one of the strongest defenders of the group, his opponents' PPG did indeed dip by nearly a point, though he still gave up an edge in scoring. The totals are perhaps the most skewed against him than anyone, as Johnson's best years statistically came when most rebound, assist and TS game logs were unavailable. His last few seasons with the Clippers drag down his winning percentage from an otherwise quite respectable showing considering he was most often facing Bird and Erving.
Code: Select all
Player   Year    W   L Vs. Exp  PPG    Rel  RPG   Rel   APG   Rel    TS    Rel
Johnson  1978    5   4  +2.01  21.11 +1.65   NA    NA    NA    NA    NA     NA
Top SFs  1978    4   5  -2.01  26.56 +3.97   NA    NA    NA    NA    NA     NA
Johnson  1979    7   7  -3.52  22.57 -3.04   NA    NA    NA    NA    NA     NA
Top SFs  1979    7   7  +3.52  19.86 +0.44   NA    NA    NA    NA    NA     NA
Johnson  1980    5   6  -0.99  23.18 +1.48   NA    NA    NA    NA    NA     NA
Top SFs  1980    6   5  +0.99  22.27 -1.93   NA    NA    NA    NA    NA     NA
Johnson  1981   12  11  -1.42  22.78 +2.51   NA    NA    NA    NA    NA     NA
Top SFs  1981   11  12  +1.42  23.83 -0.24   NA    NA    NA    NA    NA     NA
Johnson  1982   11   9  +0.18  16.35 -0.15   NA    NA    NA    NA  .4947 -.0714
Top SFs  1982    9  11  -0.18  23.00 -1.71   NA    NA    NA    NA  .5837 -.0044
Johnson  1983   19  12  +1.57  21.00 -0.43   NA    NA    NA    NA  .5231 -.0200
Top SFs  1983   12  19  -1.57  19.81 -2.56   NA    NA    NA    NA  .5102 -.0494
Johnson  1984   17  21  -2.14  21.84 +1.10   NA    NA    NA    NA  .5456 +.0117
Top SFs  1984   21  17  +2.14  21.82 -1.90   NA    NA    NA    NA  .5530 -.0114
Johnson  1985    8  14  +1.71  16.86 +0.46   NA    NA    NA    NA  .5155 +.0268
Top SFs  1985   14   8  -1.71  24.86 -0.04   NA    NA    NA    NA  .5523 -.0220
Johnson  1986    8  16  +0.82  20.54 +0.21  5.38 -0.17  3.25 -0.52 .5655 +.0104
Top SFs  1986   16   8  -0.82  25.75 +0.68  6.13 +0.20  4.67 +0.86 .5749 -.0017
Johnson  1987    0   3  -3.65  14.67 -1.93  3.00 -0.30  2.67 -0.13 .5584 +.0799
Top SFs  1987    3   0  +3.65  24.67 +1.95  6.33 +1.31  5.33 +2.16 .5964 +.0463
Johnson  Total  92 103  -0.30  20.52 +0.42  5.11 -0.19  3.19 -0.48 .5346 -.0008
Top SFs  Total 103  92  +0.30  22.83 -0.77  6.15 +0.33  4.74 +1.00 .5514 -.0180
:
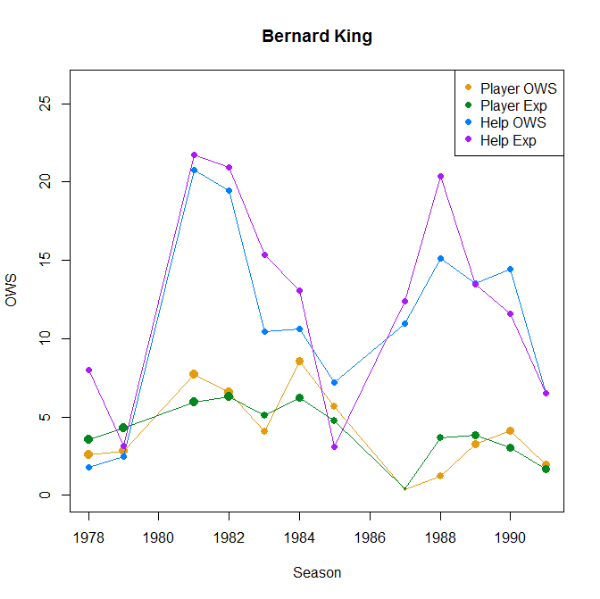
A tale of really three careers here, as his stints with New Jersey and Golden State saw bad to ho hum team success but general edges in scoring for King, his 83-85 NYK glory years saw a growing scoring gap but further poor team results, and his post-injury career saw King generally losing the scoring and efficiency battle handily and similar poor team success. The .389 winning percentage is the worst of all 9 players. It's just a shame that his knee injury kept us from seeing if he could become even more special.
Code: Select all
Player   Year    W   L Vs. Exp  PPG    Rel  RPG   Rel   APG   Rel     TS    Rel
King     1978    1   9  -3.02  26.60 +2.44   NA    NA    NA    NA     NA     NA
Top SFs  1978    9   1  +3.02  20.80 +0.29   NA    NA    NA    NA     NA     NA
King     1979    8   9  +2.38  19.29 -2.28   NA    NA    NA    NA     NA     NA
Top SFs  1979    9   8  -2.38  18.88 -2.21   NA    NA    NA    NA     NA     NA
King     1981    7   8  +0.97  26.60 +4.74   NA    NA    NA    NA     NA     NA
Top SFs  1981    8   7  -0.97  23.87 -1.05   NA    NA    NA    NA     NA     NA
King     1982    9   8  -2.16  23.53 +0.33   NA    NA    NA    NA     NA     NA
Top SFs  1982    8   9  +2.16  25.18 +0.30   NA    NA    NA    NA     NA     NA
King     1983    9  18  -1.11  21.26 -0.59   NA    NA    NA    NA   .5553 -.0107
Top SFs  1983   18   9  +1.11  18.56 -3.26   NA    NA    NA    NA   .5160 -.0419
King     1984   15  18  +0.05  26.45 +0.13   NA    NA    NA    NA   .6045 -.0143
Top SFs  1984   18  15  -0.05  24.06 +0.87   NA    NA    NA    NA   .5833 +.0243
King     1985    5  12  +3.31  30.35 -2.54   NA    NA    NA    NA   .5386 -.0465
Top SFs  1985   12   5  -3.31  22.76 -1.28   NA    NA    NA    NA   .5617 +.0048
King     1987    0   3  -0.33  23.00 +0.33  5.33 +0.00  3.00 -0.17  .5777 +.0290
Top SFs  1987    3   0  +0.33  28.33 +4.64  4.00 -1.80  3.33 -0.55  .6742 +.0615
King     1988    9  14  +1.44  13.30 -3.91  2.74 -1.32  2.48 -0.30  .5248 -.0249
Top SFs  1988   14   9  -1.44  28.04 +2.69  5.83 +0.16  3.52 -0.19  .5835 +.0062
King     1989    4  11  -1.70  19.73 -0.93  4.40 -0.34  4.47 +0.84  .5232 -.0116
Top SFs  1989   11   4  +1.70  27.60 +6.09  5.53 +0.34  3.40 +0.47  .6159 +.0634
King     1990    8   6  +1.28  20.00 -2.40  4.21 -0.71  3.29 -1.30  .5598 +.0146
Top SFs  1990    6   8  -1.28  21.07 -1.17  6.29 -0.20  3.93 -0.10  .4974 -.0567
King     1991    2   5  -1.26  20.71 -7.68  3.86 -1.13  4.00 -0.56  .4679 -.0590
Top SFs  1991    5   2  +1.26  20.14 -2.63  7.00 -0.60  4.57 +0.11  .4782 -.0648
King     Total  77 121  +0.16  22.48 -0.92  3.73 -0.86  3.34 -0.28  .5558 -.0184
Top SFs  Total 121  77  -0.16  23.12 +0.03  5.90 -0.06  3.69 +0.01  .5630 +.0015
:
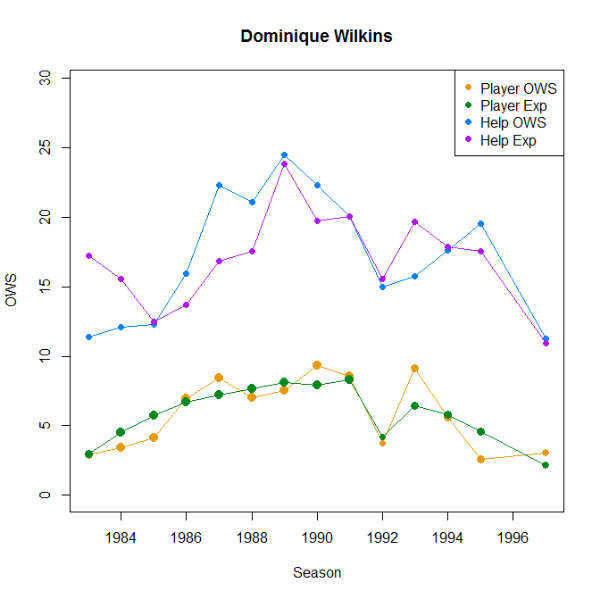
Nique had a predictable scoring edge of nearly 3 PPG (though interestingly both his scoring AND his opponents' scoring was down over a point on season averages) on an equally predictable efficiency deficit of nearly 4% TS. The rebounding and assist stats are more relevant here as they encompass a larger part of his career, and the rebounding advantage and assist deficit that is shown is also largely expected. His teams were outperformed to the tune of over a point per game based on SRS expectations (worst of all 9 players considered here), and only in 1987 and 1991 did they post at least 1 more win than opponents.
Code: Select all
Player   Year    W   L Vs. Exp  PPG    Rel  RPG   Rel   APG   Rel     TS    Rel
Wilkins  1983   10  18  -2.96  15.32 -2.17   NA    NA    NA    NA   .4727 -.0513
Top SFs  1983   18  10  +2.96  23.82 +0.90   NA    NA    NA    NA   .5561 -.0011
Wilkins  1984   15  17  +1.62  20.75 -0.85   NA    NA    NA    NA   .5029 -.0283
Top SFs  1984   17  15  -1.62  22.19 -1.24   NA    NA    NA    NA   .5608 -.0102
Wilkins  1985    3  15  -2.60  28.78 +1.41   NA    NA    NA    NA   .5187 +.0046
Top SFs  1985   15   3  +2.60  28.61 +3.00   NA    NA    NA    NA   .5671 -.0053
Wilkins  1986    9  15  -2.06  28.96 -1.38  7.25 -0.67  3.00 +0.36  .5295 -.0064
Top SFs  1986   15   9  +2.06  23.38 -0.35  6.42 -0.94  4.67 -0.43  .5672 -.0041
Wilkins  1987   14  10  -1.40  28.50 -0.54  6.25 -0.00  3.25 -0.05  .5258 -.0169
Top SFs  1987   10  14  +1.40  22.04 -1.28  5.63 -0.03  4.08 +0.10  .5557 -.0333
Wilkins  1988   11  16  -1.15  29.63 -1.10  6.11 -0.32  2.33 -0.54  .5190 -.0148
Top SFs  1988   16  11  +1.15  19.96 -4.66  4.78 -1.70  3.78 -0.74  .5525 -.0331
Wilkins  1989    6   9  -3.80  25.07 -1.17  7.00 +0.09  2.33 -0.30  .5368 +.0085
Top SFs  1989    9   6  +3.80  15.80 -3.97  3.93 -0.69  2.93 -0.19  .5307 -.0275
Wilkins  1990    4   9  -0.16  23.23 -3.49  5.08 -1.44  2.15 -0.35  .5294 -.0267
Top SFs  1990    9   4  +0.16  20.54 -0.95  6.00 -0.20  4.00 -0.84  .6291 +.0799
Wilkins  1991    5   3  +3.92  24.13 -1.81  7.50 -1.54  2.63 -0.65  .5538 -.0012
Top SFs  1991    3   5  -3.92  17.75 -5.27  5.00 -1.68  5.63 -0.12  .4939 -.0353
Wilkins  1992    2   1  +7.93  27.00 -1.07  7.33 +0.31  4.33 +0.57  .5335 -.0181
Top SFs  1992    1   2  -7.93  16.00 -4.09  5.00 -3.31  5.00 -1.09  .5017 -.0255
Wilkins  1993    1   1 -15.04  26.00 -3.87  8.50 +1.71  3.00 -0.20  .6366 +.0664
Top SFs  1993    1   1 +15.04  17.50 +2.61  3.50 +0.49  3.50 +0.11  .6034 +.1091
Wilkins  Total  80 114  -1.17  24.71 -1.17  6.54 -0.43  2.72 -0.17  .5192 -.0151
Top SFs  Total 114  80  +1.17  21.91 -1.27  5.32 -0.90  4.09 -0.39  .5590 -.0094
:
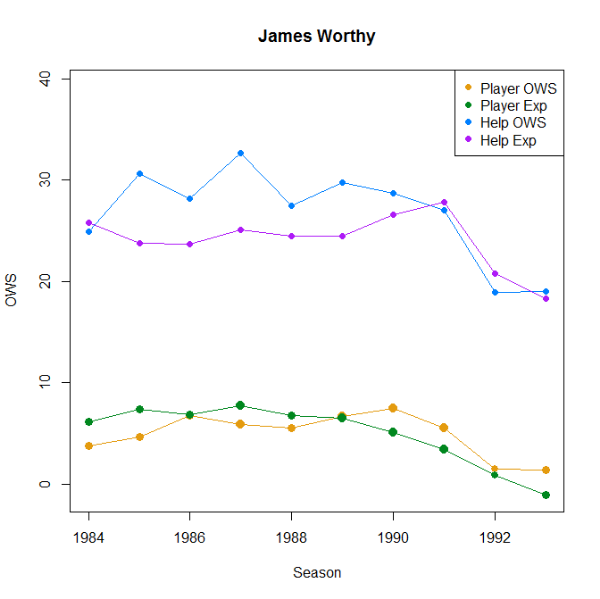
Big Game James has by far the best team success, with the top winning percentage of .672 and the top performance against SRS expectations, with the Lakers exceeding their lofty SRS expectations by nearly a point and a half, on average. He's the only player in the list who wasn't at least arguably the "leader" on the majority of his teams, and his opponents did score more than 4 PPG than he did (though Worthy's scoring increased relative to season averages by over a point while his opponents' scoring decreased by more than a point). Worthy also had a sizable edge in efficiency at nearly +3% TS relative to opponents. Like Nique, most of his games in these comparisons recorded assists and rebounds, so the deficit in both is more meaningful than it would be for others.
Code: Select all
Player   Year    W   L Vs. Exp  PPG    Rel  RPG   Rel   APG   Rel     TS    Rel
Worthy   1984   24  13  +3.18  15.57 +1.12   NA    NA    NA    NA   .6196 +.0289
Top SFs  1984   13  24  -3.18  24.97 -1.50   NA    NA    NA    NA   .5709 -.0051
Worthy   1985   27   9  +0.23  18.86 +1.24   NA    NA    NA    NA   .6096 +.0090
Top SFs  1985    9  27  -0.23  25.14 -0.74   NA    NA    NA    NA   .5795 +.0176
Worthy   1986   20  10  +0.33  19.83 -0.17  5.23 +0.07  2.57 -0.11  .5950 -.0176
Top SFs  1986   10  20  -0.33  23.63 -1.23  5.83 -0.07  4.37 +0.19  .5537 -.0129
Worthy   1987   19   7  +4.23  21.31 +1.87  5.58 -0.11  3.23 +0.47  .5940 +.0157
Top SFs  1987    7  19  -4.23  23.58 -3.33  5.96 -0.16  3.92 -1.15  .5596 -.0144
Worthy   1988   17  11  +1.43  21.29 +1.58  5.39 +0.41  4.04 +0.18  .5644 -.0063
Top SFs  1988   11  17  -1.43  25.36 +1.27  5.86 +0.77  3.18 -0.36  .5798 +.0188
Worthy   1989    9   9  -1.00  23.67 +3.21  6.50 +0.46  3.72 +0.17  .5560 -.0261
Top SFs  1989    9   9  +1.00  19.56 -1.77  5.28 +0.57  3.50 +0.11  .4992 -.0376
Worthy   1990   11   1  +1.42  21.25 +0.19  7.00 +1.03  4.42 +0.82  .5657 -.0204
Top SFs  1990    1  11  -1.42  18.08 -2.57  5.33 +0.02  2.08 -1.58  .5107 -.0324
Worthy   1991    2   2  -7.67  20.00 -1.41  4.25 -0.31  3.25 -0.28  .4673 -.0639
Top SFs  1991    2   2  +7.67  25.25 -0.28  7.50 +0.63  5.75 +0.86  .5124 -.0233
Worthy   1992    1   1  +1.58  23.50 +3.59  2.50 -3.15  4.00 -0.67  .5293 +.0392
Top SFs  1992    1   1  -1.58  23.00 -1.12  9.00 +0.67  6.00 +0.72  .5300 -.0197
Worthy   1993    1   1 +15.04  17.50 +2.61  3.50 +0.49  3.50 +0.11  .6034 +.1091
Top SFs  1993    1   1 -15.04  26.00 -3.87  8.50 +1.71  3.00 -0.20  .6366 +.0664
Worthy   Total 131  64  +1.47  19.71 +1.23  5.94 +0.19  3.14 +0.16  .5852 -.0005
Top SFs  Total  64 131  -1.47  23.74 -1.25  7.29 +0.86  4.18 -0.39  .5593 -.0038
A lot of the individual comparisons are interesting:
*Bird 35-33 against Erving, with both players having reduced scoring on greatly reduced efficiency.
*Bird 11-0 vs. Aguirre, including an SRS differential to expectations of +4.72, a scoring margin of nearly 6 PPG on nearly +14 TS%.

*Erving 26-5 vs. King despite a big scoring deficit.
*Dantley with a clear edge over English (roughly +5 PPG, +5 wins on +1.25 SRS differential, +10% TS), who has an edge over Wilkins (+1 PPG, +5 SRS differential, +2% TS), who has an arguable edge over Dantley (+7 PPG but -6% TS). Transitive property be damned!
