Michael Jordan ON-OFF By Postseason
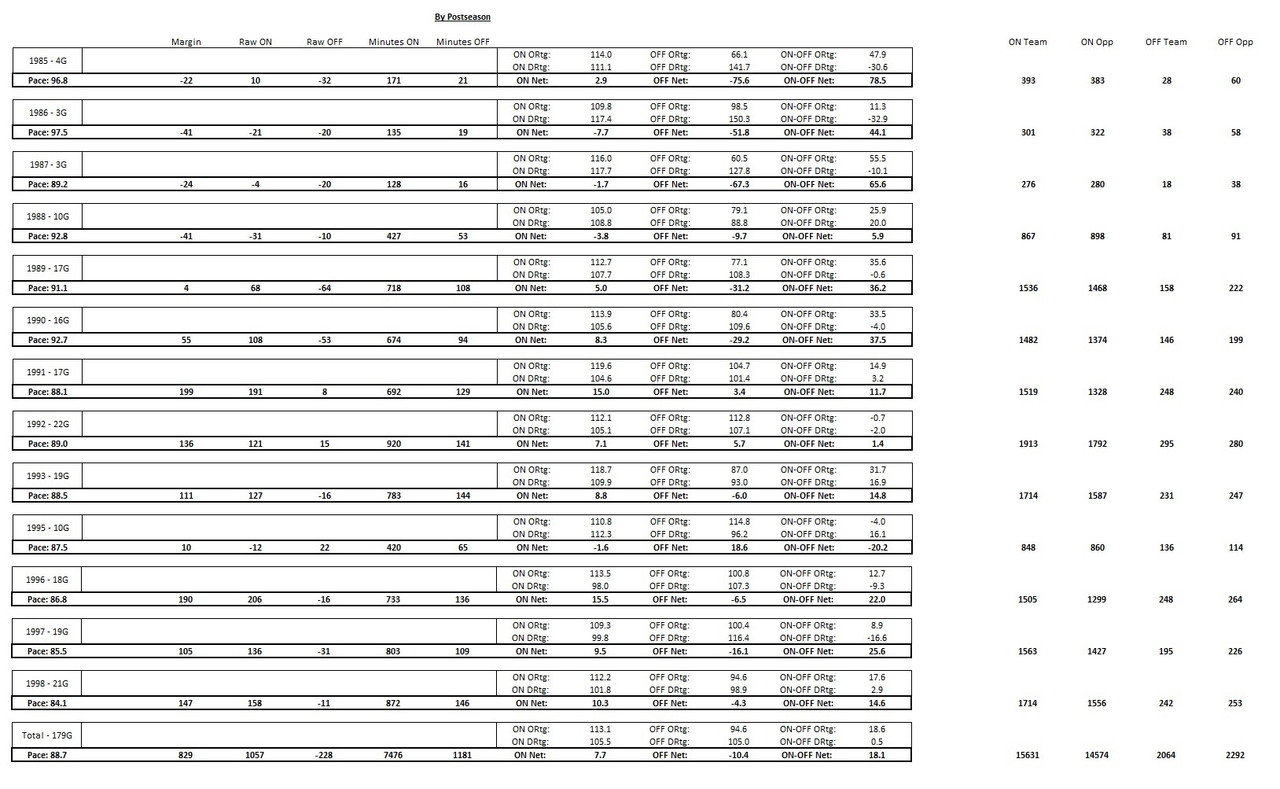
For full game-by-game data, see the spreadsheet here. The data is broken down by series and by postseason.
Michael Jordan ON-OFF Career Averages
Career: +7.7 ON -10.4 OFF +18.1 ON-OFF
These are better averages than any great player I could find since 1997.
Michael Jordan ON Court ORtg (rORtg) Regular Season / Playoffs
1985: NO DATA / 114.0 (+10.4)
1986: NO DATA / 109.7 (+7.1)
1987: NO DATA / 116.0 (+9.2)
1988: NO DATA / 105.0 (-0.7)
1989: NO DATA / 112.7 (+7.7)
1990: NO DATA / 113.9 (+7.2)
1991: NO DATA / 119.6 (+13.3)
1992: NO DATA / 112.1 (+5.2)
1993: 115.2 (+7.2) / 118.7 (+13.0)
1995: NO DATA / 110.8 (+3.7)
1996: 117.3 (+9.7) / 113.5 (+9.7)
1997: 116.3 (+9.6) / 109.1 (+6.3)
1998: 110.7 (+5.7) / 112.2 (+7.9)
2002: 107.6 (+3.4) / -------
2003: 103.8 (+0.5) / -------
1989-1998 Average: +7.8/+8.4
Title Years Average: +7.8/+9.0
Note: For the regular seasons pre-1997, I've only included the 1993 and 1996 data which is essentially complete.
For those wondering, in the 1991 and 1992 regular seasons where there is just over 2/3 of the games logged, the Bulls' offenses are 120.6 ORtg (+12.7) and 117.1 ORtg (+8.9) with Jordan on the court, respectively.
MIchael Jordan ON Court ORtg (rORtg) Playoffs - By Series
1985 MIL: 114.0 (+10.4)
1986 BOS: 109.7 (+7.1)
1987 BOS: 116.0 (+9.2)
1988 CLE: 113.3 (+7.3)
1988 DET: 96.4 (-8.9)
1989 CLE: 112.4 (+9.5)
1989 NYK: 123.1 (+15.6)
1989 DET: 105.0 (+0.3)
1990 MIL: 123.6 (+15.5)
1990 PHI: 119.5 (+11.1)
1990 DET: 105.4 (+1.9)
1991 NYK: 115.4 (+8.1)
1991 PHI: 121.6 (+13.5)
1991 DET: 126.4 (+21.8)
1991 LAL: 118.2 (+13.2)
1992 MIA: 128.9 (+18.0)
1992 NYK: 112.7 (+8.5)
1992 CLE: 109.7 (+1.5)
1992 POR: 107.7 (+3.5)
1993 ATL: 128.2 (+18.0)
1993 CLE: 122.7 (+16.7)
1993 NYK: 117.9 (+18.2)
1993 PHO: 116.4 (+9.7)
1995 CHA: 113.5 (+7.4)
1995 ORL: 109.0 (+1.2)
1996 MIA: 124.9 (+21.1)
1996 NYK: 106.6 (+3.1)
1996 ORL: 115.3 (+8.4)
1996 SEA: 114.2 (+12.1)
1997 WAS: 118.2 (+13.3)
1997 ATL: 111.8 (+9.5)
1997 MIA: 105.9 (+5.3)
1997 UTA: 105.6 (+1.6)
1998 NJN: 117.9 (+11.3)
1998 CHA: 119.5 (+2.9)
1998 IND: 116.2 (+14.6)
1998 UTA: 107.0 (+1.6)
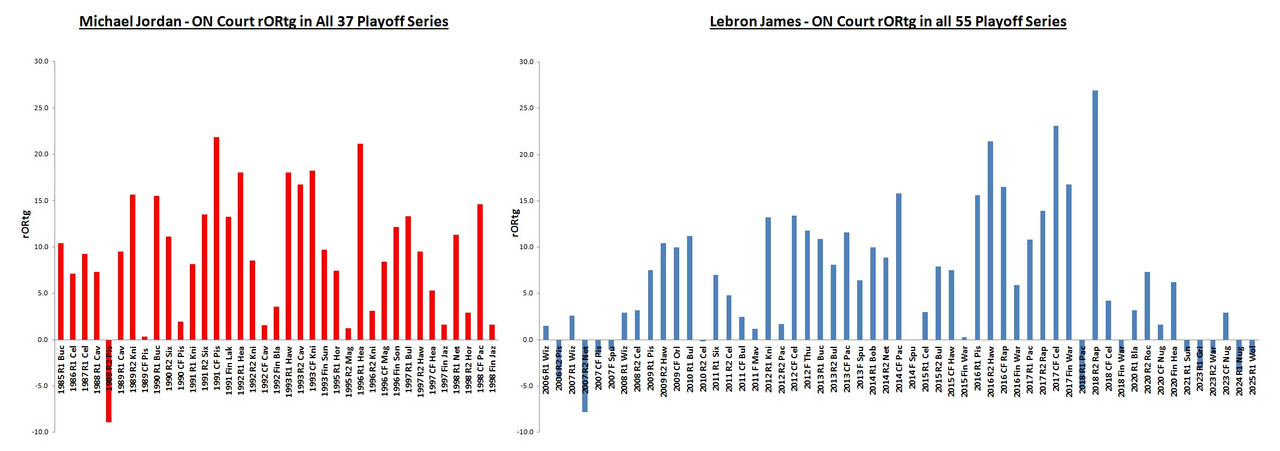
The consistency is remarkable with only one series with a negative rORtg (1988 DET). And there is only one other series below +1.2 rORtg (1989 DET).
Michael Jordan rORtg and rDRtg Playoffs ON and OFF
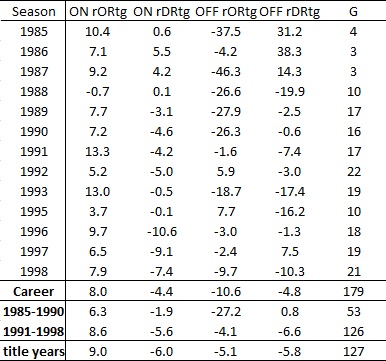
It's telling that the pre-championship Bulls had a really good offense with Jordan on the court. It's tough to find anyone without a strong offensive supporting cast that can consistently get those kind of offensive results. The +33.5 ORtg ON-OFF is pretty bonkers too. Those teams without Jordan were just utterly hopeless.
In the title years, the offenses with Jordan got better but the main difference is that they became better without him and there was a huge defensive improvement in the team. Still, he provided a ton of offensive lift even from 1991 onwards.
1991 Jordan ON-OFF Numbers - The Peak
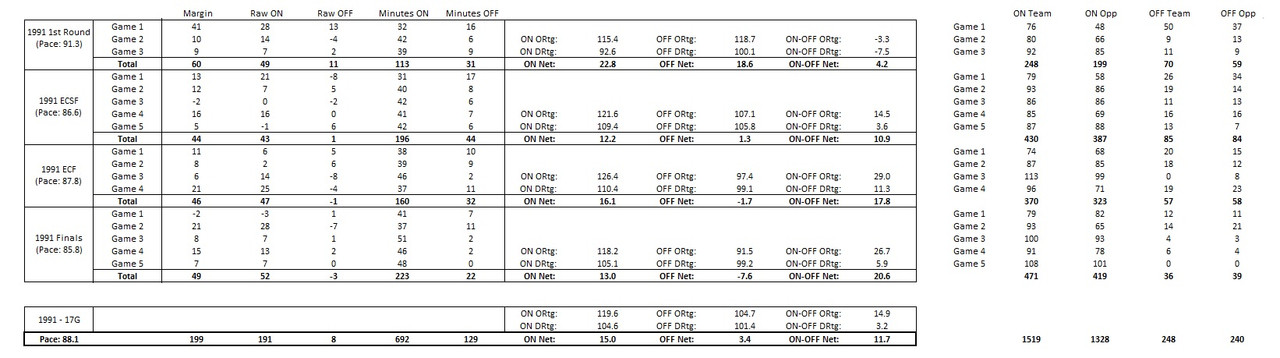
A decidedly bonkers 119.5 ORtg (+13.3) when Jordan is on the court in the 1991 playoffs!
The only three higher ones by offensive centerpieces in a championship run are Curry in 2017 with 126.0 ORtg (+18.5), Lebron in 2016 with 118.2 ORtg (+14.2) and Magic in 1985 with 120.6 (+13.4). But it gets more interesting...
With just the last three rounds (cutting out the 1st rounds against minnows), the Bulls jump up to 121.6 ORtg (+15.7) with Jordan on the court which clearly surpasses both Lebron 2016 who posts 118.0 ORtg (+13.7) and 1985 Magic who posts 118.4 ORtg (+11.1). Only 2017 Curry is still ahead.
I find that Jordan's 1991 playoff run is probably the most impressive offensive run ever. Pippen was a good secondary star but not an offensive dynamo and there were some good shooters on the roster (Paxson, Armstrong, Hodges) but the offensive talent of this Bulls team and the schematic approach (i.e. little 3pt shooting) just don't compare to teams like the 2017 Warriors, 2016 Cavaliers, 2001 Lakers etc. Jordan's huge scoring load with strong efficiency, volume playmaking (one of the highest box creations ever in 1991) and historically low turnovers made him the most effective offensive player ever at his peak in my book. It's also worth noting that the Bulls didn't sacrifice defense to produce that offense. They were an elite team on both ends of the floor.
The 1993 run also seems crazy where the Bulls have a 118.7 ORtg (+13.0) with Jordan on the court but when he sits they have a 87.0 ORtg (-18.7). A +30.7 is surely one of the biggest ORtg ON-OFF in NBA history and it's just unfathomable on a title team.
Others Comparisons with Lebron and Other Greats
There is this infamous photo from Thinking Basketball that has been circulating quite a bit on here as well as on social media.
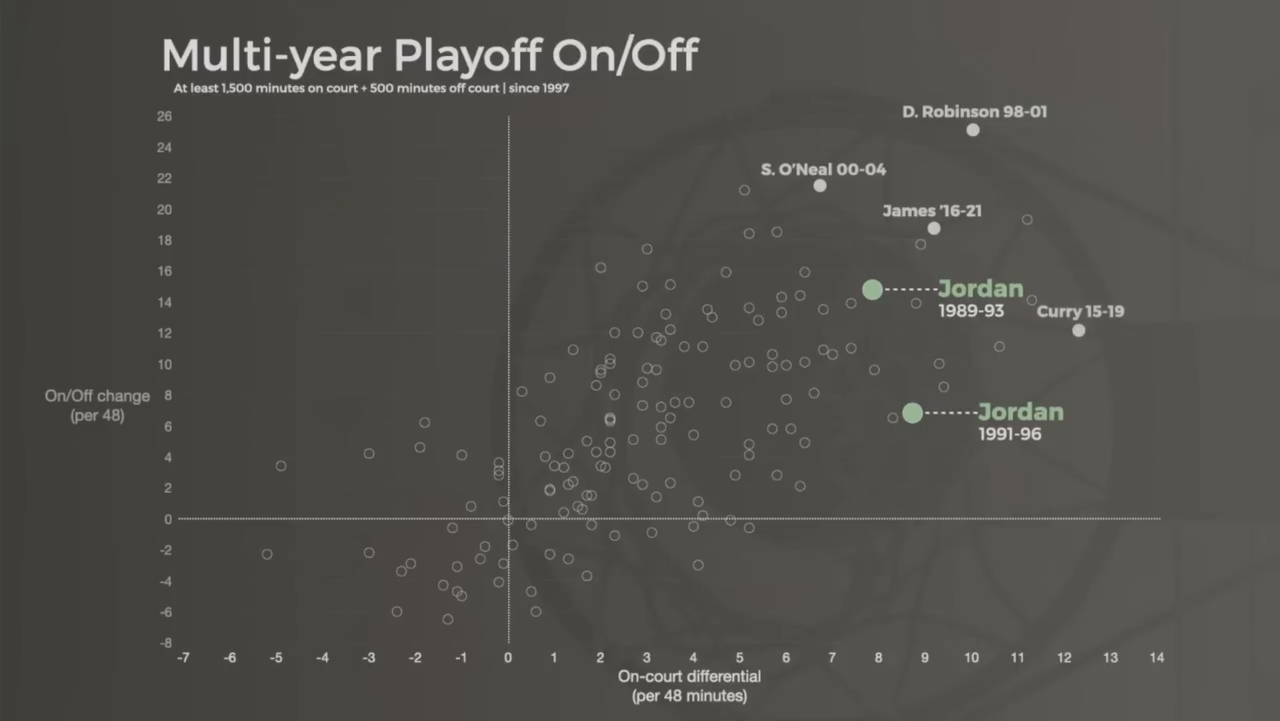
People post it to show how Jordan's 5-year peak isn't THAT good. The thing is... those 5-year stretches by Robinson, Shaq and Lebron are definitely not their peaks but simply their best ON-OFF stretches. Curry's 5-year peak is spot on but I don't know how Ben is getting above +12 ON court for 2015-19 Curry. I'm getting about +10.1... Might be filtering injured games or applying some kind of filter?!?
Anyways, I created a similar graph but the best 5-year stretches have to come within (at least arguable) peak years.
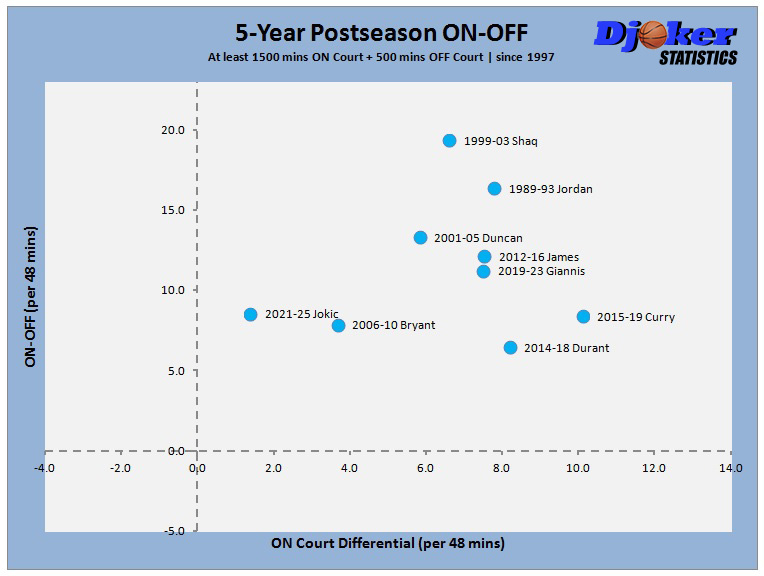
Full Data:
Spoiler:
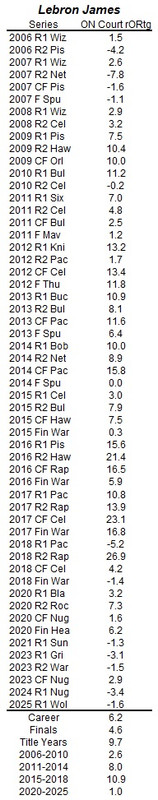
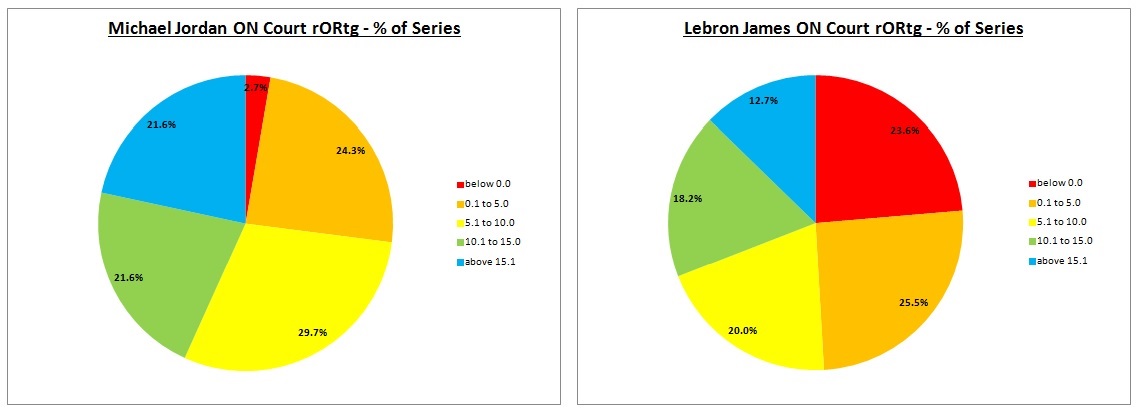
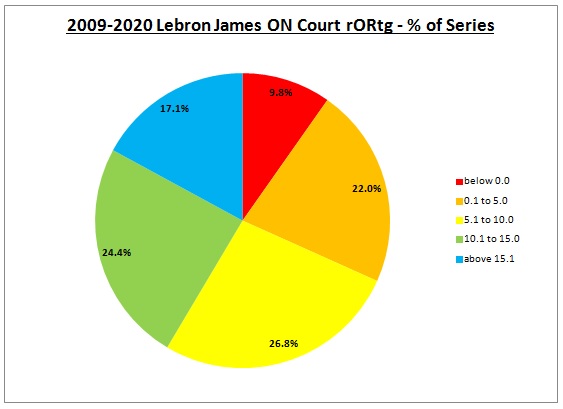
Just to follow up on the offensive engine discussion a little while back. Apart from superior averages by career/prime/title years/finals etc. (almost any way one slices it...) I think it's Jordan's consistency that really sets him apart as well. Just 1/37 (2.7%) series with a negative rORtg when ON the court. Lebron has 13/55 (23.6%) series with a negative rORtg. When looking at all series below +5 rORtg, Jordan has 10/37 (27.0%) and Lebron has 27/55 (49.1%). Even if being generous and just taking his prime from 2009-2020, Lebron still has 4/41 (9.8%) series with a negative rORtg and 13/41 (31.8%) below +5 rORtg. The pie charts illustrate those differences well.
Full Data:
Spoiler: