What impact metrics show MJ as a GOAT candidate?

Moderators: Clyde Frazier, Doctor MJ, trex_8063, penbeast0, PaulieWal

ShaqAttac
Rookie
Posts: 1,189
And1: 369
Joined: Oct 18, 2022
 

Re: What impact metrics show MJ as a GOAT candidate? 

Post#181 » by ShaqAttac » Thu Feb 16, 2023 4:06 am

DraymondGold wrote:
falcolombardi wrote:.
\

Bes

[b]For 1990 on/off:
Jordan's "off" rating is off the page (his teammates performed that poorly :o )... however you can estimate the 1990 off rating by looking at the 3-year on/off averages from 1988-90, 1989-91, 1990-92, and using the known values for 88, 89, 91, and 92. The fact that we have three separate 3-year-averages is great, because it means we can do a by-eye measurement multiple times and when we take the average, hopefully decrease the error. It looks like 3 -year averages are averaged using a minute-weighted average (rather than game number). I got roughly -26.5 +/- 1ish for his 1990 off-rating, but there's some uncertainty here based on how accurately I could measure by eye.

I dont understand the 1990 part. Isnt that like algebra? Why is there no real answer?
User avatar
Bad Gatorade
Senior
Posts: 715
And1: 1,871
Joined: Aug 23, 2016
Location: Australia
   

Re: What impact metrics show MJ as a GOAT candidate? 

Post#182 » by Bad Gatorade » Thu Feb 16, 2023 4:18 am

AEnigma wrote:Logical gibberish. “Oh if the benches are not good then that is your fault.”

Tell me, what did all these poor suppressed bench players do on other teams? How exactly was Lebron keeping them down with his evil evil monopolising offensive system, which I am definitely sure you can articulate in specific terms and not Skip Bayless bromides.


I remember that people used to criticise Harden quite a bit because his on/off numbers weren't of the calibre one would expect relative to his box score numbers (i.e. his monopolisation caused inflation). In 2017, people specifically said that "the team is even better with Harden on the bench than when he is playing!" from January onwards.

...

So when this was happening, I looked into this. Part of it was that Harden is... not a great defensive player, lol. But the bigger part of it all was that the bench lineups featuring Eric Gordon and/or Patrick Beverley were producing at a +6.1 level per 100 possessions. Both players played far more alongside Harden than without him. Did they forget how to play without Harden? Nope - Patrick Beverley went from 3.5 assists per 100 to 12 (!) per 100. Eric Gordon went from 20.6 points per 100 to 33.9 (!) whilst having his TS% drop by... less than a percent.

In this case, it's almost as if the opposite happened - the reduced role for Gordon/Beverley playing alongside Harden allowed them to explode and feast on bench lineups. Patrick Beverley was legitimately leading very strong offensively slanted lineups against bench units as a heliocentric playmaker :lol:

Why do other players forget how to play, but then Patrick Beverley magically turned into Jason Kidd? How does Eric Gordon manage to increase his volume so much without any real cost to his efficiency?

I suppose Harden (far less heliocentric, known as a dedicated gym rat who is never out of shape, never attends strip clubs and parties before games) has all of those desirable qualities that LeBron just lacks, right? That's why everybody just forgets basketball without LeBron, but Harden brings out the best of his teammates when he's on the bench?

:banghead:

(Full disclaimer - as my team allegiance would imply, I love Harden lol. I just think that the argument used against LeBron is kind of silly. Inventive, yet silly)
I use a lot of parentheses when I post (it's a bad habit)
Bidofo
Pro Prospect
Posts: 776
And1: 975
Joined: Sep 20, 2014
     

Re: What impact metrics show MJ as a GOAT candidate? 

Post#183 » by Bidofo » Thu Feb 16, 2023 4:37 am

DraymondGold wrote:
falcolombardi wrote:.
Since we were discussing this, here's

Playoff on/off: Jordan vs LeBron

I went ahead and got LeBron and Jordan's playoff on/off for every prime year :D As I've said before, raw on/off is just about the noisiest stat in the game and therefore should not be used as a ranking stat. Further, it doesn't correct for team or opponent context, so it has systematic biases. But it's still interesting, and you might use it as an order-of-magnitude estimate for asking "does this player correlate with being really valuable?"

Here are the on/off numbers:
Spoiler:
LeBron's Playoff on/off per 48 minutes:
2007: 19.8
2008: 24.6
2009: 11.7
2010: 22.2
2011: -11.7
2012: 22.5
2013: 1.2
2014: 7.5
201:5 2.2
2016: 18.7
2017: 32
2018: 4.2
2020: 14.7
2021: 34.6

Jordan's Playoff on/off per 48 minutes:
1988: 4.25
1989: 24
1990: 33.75
1991: 12
1992: 2
1993: 10.5
[1995: -16.9 to -24.0 ish. Greater uncertainty here, see Disclaimers if you care]
1996: 16
1997: 22
1998: 12.25

Best multi-year samples
LeBron's best 1-year average: +34.6 (single playoff series in 2021; +32 in 2017 if looking at non-single-series years)
LeBron's best 2-year average: +24.8 (2016-2017)
LeBron's best 3-year average: +19.4 (2008-2010; +10.8 in Miami from 2012-2014; +17.7 in Cleveland from 2015-2017)
LeBron's best 4-year average: +18.0 (2017-2021)
LeBron's best 5-year average: +18.2 (2016-2021; +14 from 2015-2020 if discounting the single-series outlier in 2021)
LeBron's best 6-year average: +13.8 (2012-2017)
LeBron's best 7-year average: +14.0 (2014-2021; +12.4 from 2012-2018 if discounting the single-series outlier in 2021)
LeBron's best 8-year average: +12.7 (2012-2020; +8.6 from 2009-2015 from younger LeBron)
LeBron's best 9-year average: +13.4 (2012-2021)

Jordan's best 1-year average: +33.75 (1990; +24 in 1989)
Jordan's best 2-year average: +28.7 (1989-1990; +19.1 from 1997-1997 if we take older Jordan)
Jordan's best 3-year average: +23.4 (1989-1991; +17.0 from 1996-1998 if we take older Jordan)
Jordan's best 4-year average: +20.2 (1988-1991)
Jordan's best 5-year average: +18.5 (1989-1993; +12.4 from 1992-1998 if we take older Jordan)
Jordan's best 6-year average: +15.6 (1989-1996 discounting 1995 which has greater uncertainty; +14.4 from 1988-1993 becomes best if we include 1995)
Jordan's best 7-year average: +16.6 (1989-1997 discounting 1995 which has greater uncertainty; it's +12.3 to +12.9 ish if we include 1995)
Jordan's best 8-year average: +16.0 (1989-1998 discounting 1995 which has greater uncertainty; it's +13.6 to +14.2 ish if we include 1995)
Jordan's best 9-year average: +15.2 (1988-1998 discounting 1995 which has greater uncertainty; it's +13.5 to +13.9 ish if we include 1995)
Jordan's best 10-year average: Unknown. We don't have data before 1988 :(

Summary:
LeBron has better playoff on/off in 1 year (but only because of an outlier single-series playoffs in 2021; Jordan's ahead otherwise)
Jordan has better playoff on/off in 2 years
Jordan has better playoff on/off in 3 years
Jordan has better playoff on/off in 4 years
LeBron has better playoff on/off in 5 years (but only because of an outlier single-series playoffs in 2021; Jordan's ahead otherwise)
Jordan has better playoff on/off in 6 years
Jordan has better playoff on/off in 7 years (but LeBron comes out ahead if we include 1995 which has greater uncertainty)
Jordan has better playoff on/off in 8 years
Jordan has better playoff on/off in 9 years
Wow! :o

So LeBron is ahead in his single-season single-series playoffs, and that single series is enough to drag his best 5-year on/off ahead. But Jordan's ahead in basically everything other sample size.

To reiterate, on/off is not a ranking stat. It's just about the noisiest stat there is. But like I said before, I'm not sure on/off is actually so favorable to LeBron... Jordan arguably looks better than LeBron in playoff on/off.

Sources and Disclaimers:
Spoiler:
Source for LeBron's stats is PBPstats for on/off per 100 possessions and Basketball Reference to convert from per 100 possessions to per 48 minutes.
Source for Jordan is the Thinking Basketball video [url][/url]. Note that I had to take Jordan's numbers by eye, since the exact numbers are not stated: I rounded to the nearest 0.25 by eye, so these might be off by <1.

For 1990 on/off: Jordan's "off" rating is off the page (his teammates performed that poorly :o )... however you can estimate the 1990 off rating by looking at the 3-year on/off averages from 1988-90, 1989-91, 1990-92, and using the known values for 88, 89, 91, and 92. The fact that we have three separate 3-year-averages is great, because it means we can do a by-eye measurement multiple times and when we take the average, hopefully decrease the error. It looks like 3 -year averages are averaged using a minute-weighted average (rather than game number). I got roughly -26.5 +/- 1ish for his 1990 off-rating, but there's some uncertainty here based on how accurately I could measure by eye.

For 1995 on/off: it doesn't look like they showed the on or off rating for Jordan. I could do a ballpark-estimation here using the 3-year average like I did for 1990, but the uncertainties here would be way greater, since we get three 3-year averages to pin-down 1990's value while we only get one 3-year average to figure out what 1995 was. You'd also have to make assumptions about e.g. whether 1994 was included in the "off" rating, which is not super clear from context.

But just to be fair, here's an estimate for 1995:
( [on rating in season 1]*[on-minutes in season 1] + [on rating in season 2]*[on-minutes in season 2] + [on rating in season 3]*[on-minutes in season 3]) / ([on-minutes in season 1] + [on-minutes in season 2] + [on-minutes in season 3] ) = [3-year average on rating ].

So: 1995 on-rating estimation (with greater uncertainty from my by-eye measurement):
(7.5* 783 + 0 + x* 420)/(783 + 0 + 420) = 4.25 -> x = -1.8 on rating in 1995

Off rating for 1995 (if the 3 year average in the video included 1994 for Jordan's off rating):
(-3*(927 - 783) + (28/10)*(485 - 0) + x*(485 - 420)/(927 - 783 + 485 - 0 + 485 - 420)
-> x = +25.8 off rating in 1995 if Thinking Basketball used 1994 for the 3-year-average average off rating
-> x = +18.7 off rating in 1995 if Thinking Basketball did not use 1994 for the average off rating

so Jordan's 1995 playoff on/off is something like -16.9 to -24.0 (if my math, by-eye-measurement, and assumptions are right).

This would decrease Jordan's best 8-year average to: -13.6 to -14.2 ish. Still greater than LeBron's 8 year average, but by a less extreme margin

This is all fantastic and useful information, but there's a minor yet significant caveat: those averages are not just averages, but of consecutive year averages. Honestly, I'm not sure why consecutive averages are used so heavily in this discourse; it makes more sense to me to average the best stretches, and it makes more sense for someone like LeBron who's had some valleys amongst his monster peaks. In your consecutive calculations, you pretty much have to work around 2011 which would destroy any sample so you can't even get 2 of his best years that are right on the outside in 2010 and 2012, let alone getting to his best and second-best in 2017 and 2008 in a sample. Generally speaking, basically ALL of Jordan's best years stats-wise, advanced or otherwise, are grouped together (call it a shorter prime :wink: ). It probably makes less of a difference for something like on/off anyway, since it's reliant on so many other things where you can get poor results even in objectively great runs (see: 1992 Jordan, 2018 LeBron), but I'd say even stuff like PPG, BPM, etc. should be averaged by the best years. Frankly I'm going to chalk this up to bballref's inability to average anything except adjacent seasons, I'm not sure why they haven't implemented the option to choose which seasons to average, or maybe they do and I don't know how. When we do order by best years (only top 9 of each, ignoring 2021):

2017: 32
2008: 24.6
2012: 22.5
2010: 22.2
2007: 19.8
2016: 18.7
2020: 14.7
2009: 11.7
2014: 7.5

1990: 33.75
1989: 24
1997: 22
1996: 16
1998: 12.25
1991: 12
1993: 10.5
1988: 4.25
1992: 2

So Jordan has a small lead for best year, LeBron has an even smaller lead for second and third best, and then LeBron destroys every other year. I'm not sure about averages but these years are mostly Finals runs. The games and minutes played should be close enough where we can more or less can eyeball it, and Jordan at BEST wins probably 1yr, 2yr, and 3yr averages (maybe 4??), and it's still possible LeBron wins 2yr and 3yr when accounting for time played but I'm not sure. I'd be curious if you have a quick and simple way to get that math done :D
DraymondGold
Senior
Posts: 596
And1: 775
Joined: May 19, 2022

Re: What impact metrics show MJ as a GOAT candidate? 

Post#184 » by DraymondGold » Thu Feb 16, 2023 4:38 am

ShaqAttac wrote:
DraymondGold wrote:
falcolombardi wrote:.
\

Bes

[b]For 1990 on/off:
Jordan's "off" rating is off the page (his teammates performed that poorly :o )... however you can estimate the 1990 off rating by looking at the 3-year on/off averages from 1988-90, 1989-91, 1990-92, and using the known values for 88, 89, 91, and 92. The fact that we have three separate 3-year-averages is great, because it means we can do a by-eye measurement multiple times and when we take the average, hopefully decrease the error. It looks like 3 -year averages are averaged using a minute-weighted average (rather than game number). I got roughly -26.5 +/- 1ish for his 1990 off-rating, but there's some uncertainty here based on how accurately I could measure by eye.

I dont understand the 1990 part. Isnt that like algebra? Why is there no real answer?
Good question! Yep, it is algebra, and yep there is a real answer! It's just the fact that it's off the page might increase our uncertainty slightly (since it involves multiple by-eye measurements).

To be more explicit (you did ask for the math! :lol: ), here's how it works out:

1990 Jordan's on-rating by eye: +7.25
1990 Jordan's off-rating: not shown in video (it's outside the range shown), so we calculate off-rating using the formula:

( [off rating in season 1]*[off-minutes in season 1] + [off rating in season 2]*[off-minutes in season 2] + [off rating in season 3]*[on-minutes in season 3]) / ([off-minutes in season 1] + [off-minutes in season 2] + [off-minutes in season 3] ) = [3-year average off rating ].
This is just the formula for the 3-year average off rating, weighted by minutes.

Then we plug in the valves (measured by eye) from the video, and solve for the 1989 off-rating x:
Estimating 190 off-rating using 88-90 average:
((480 total minutes - 427 minutes played = off minutes)*(-8 off rating) + (826-718)*(-19.25) + (768-674)*x )/(480 - 427 + 826 - 718 + 768 - 674) = -20
x = -27.6277 estimated off rating

Estimating 1990 off-rating using 89-91 average:
((826-718)*(-19.25) + (768-674)*x + (821-689)*1.75)/(826 - 718 + 768 - 674 + 821 - 689) = -13
x = -26.5319

Estimating 1990 off-rating using 90-92 average:
( (768-674)*x + (821-689)*1.75 + (1061 - 920)*5.5 )/(768 - 674 + 821 - 689 + 1061 - 920) = -3.75
x = -25.348

Average off-rating from the 3 estimations: -26.5

Total 1990 Off-rating = on rating - off rating = 7.25 - (-26.5) = +33.75

So there's clearly some uncertainty in the off-rating based on my by-eye estimates, but they all produce around the same 3 year average. [Same process is used to estimate 1995, but we only are shown the three year average of 1993-1995].
DraymondGold
Senior
Posts: 596
And1: 775
Joined: May 19, 2022

Re: What impact metrics show MJ as a GOAT candidate? 

Post#185 » by DraymondGold » Thu Feb 16, 2023 4:51 am

Bidofo wrote:
DraymondGold wrote:
falcolombardi wrote:.
Since we were discussing this, here's

Playoff on/off: Jordan vs LeBron

I went ahead and got LeBron and Jordan's playoff on/off for every prime year :D As I've said before, raw on/off is just about the noisiest stat in the game and therefore should not be used as a ranking stat. Further, it doesn't correct for team or opponent context, so it has systematic biases. But it's still interesting, and you might use it as an order-of-magnitude estimate for asking "does this player correlate with being really valuable?"

Here are the on/off numbers:
Spoiler:
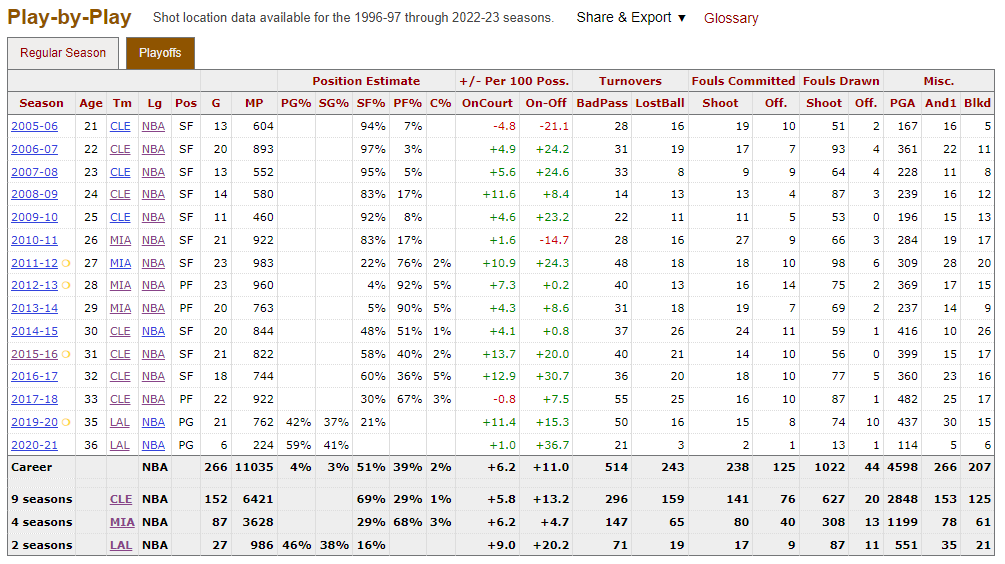
LeBron's Playoff on/off per 48 minutes:
2007: 19.8
2008: 24.6
2009: 11.7
2010: 22.2
2011: -11.7
2012: 22.5
2013: 1.2
2014: 7.5
201:5 2.2
2016: 18.7
2017: 32
2018: 4.2
2020: 14.7
2021: 34.6

Jordan's Playoff on/off per 48 minutes:
1988: 4.25
1989: 24
1990: 33.75
1991: 12
1992: 2
1993: 10.5
[1995: -16.9 to -24.0 ish. Greater uncertainty here, see Disclaimers if you care]
1996: 16
1997: 22
1998: 12.25

Best multi-year samples
LeBron's best 1-year average: +34.6 (single playoff series in 2021; +32 in 2017 if looking at non-single-series years)
LeBron's best 2-year average: +24.8 (2016-2017)
LeBron's best 3-year average: +19.4 (2008-2010; +10.8 in Miami from 2012-2014; +17.7 in Cleveland from 2015-2017)
LeBron's best 4-year average: +18.0 (2017-2021)
LeBron's best 5-year average: +18.2 (2016-2021; +14 from 2015-2020 if discounting the single-series outlier in 2021)
LeBron's best 6-year average: +13.8 (2012-2017)
LeBron's best 7-year average: +14.0 (2014-2021; +12.4 from 2012-2018 if discounting the single-series outlier in 2021)
LeBron's best 8-year average: +12.7 (2012-2020; +8.6 from 2009-2015 from younger LeBron)
LeBron's best 9-year average: +13.4 (2012-2021)

Jordan's best 1-year average: +33.75 (1990; +24 in 1989)
Jordan's best 2-year average: +28.7 (1989-1990; +19.1 from 1997-1997 if we take older Jordan)
Jordan's best 3-year average: +23.4 (1989-1991; +17.0 from 1996-1998 if we take older Jordan)
Jordan's best 4-year average: +20.2 (1988-1991)
Jordan's best 5-year average: +18.5 (1989-1993; +12.4 from 1992-1998 if we take older Jordan)
Jordan's best 6-year average: +15.6 (1989-1996 discounting 1995 which has greater uncertainty; +14.4 from 1988-1993 becomes best if we include 1995)
Jordan's best 7-year average: +16.6 (1989-1997 discounting 1995 which has greater uncertainty; it's +12.3 to +12.9 ish if we include 1995)
Jordan's best 8-year average: +16.0 (1989-1998 discounting 1995 which has greater uncertainty; it's +13.6 to +14.2 ish if we include 1995)
Jordan's best 9-year average: +15.2 (1988-1998 discounting 1995 which has greater uncertainty; it's +13.5 to +13.9 ish if we include 1995)
Jordan's best 10-year average: Unknown. We don't have data before 1988 :(

Summary:
LeBron has better playoff on/off in 1 year (but only because of an outlier single-series playoffs in 2021; Jordan's ahead otherwise)
Jordan has better playoff on/off in 2 years
Jordan has better playoff on/off in 3 years
Jordan has better playoff on/off in 4 years
LeBron has better playoff on/off in 5 years (but only because of an outlier single-series playoffs in 2021; Jordan's ahead otherwise)
Jordan has better playoff on/off in 6 years
Jordan has better playoff on/off in 7 years (but LeBron comes out ahead if we include 1995 which has greater uncertainty)
Jordan has better playoff on/off in 8 years
Jordan has better playoff on/off in 9 years
Wow! :o

So LeBron is ahead in his single-season single-series playoffs, and that single series is enough to drag his best 5-year on/off ahead. But Jordan's ahead in basically everything other sample size.

To reiterate, on/off is not a ranking stat. It's just about the noisiest stat there is. But like I said before, I'm not sure on/off is actually so favorable to LeBron... Jordan arguably looks better than LeBron in playoff on/off.

Sources and Disclaimers:
Spoiler:
Source for LeBron's stats is PBPstats for on/off per 100 possessions and Basketball Reference to convert from per 100 possessions to per 48 minutes.
Source for Jordan is the Thinking Basketball video [url][/url]. Note that I had to take Jordan's numbers by eye, since the exact numbers are not stated: I rounded to the nearest 0.25 by eye, so these might be off by <1.

For 1990 on/off: Jordan's "off" rating is off the page (his teammates performed that poorly :o )... however you can estimate the 1990 off rating by looking at the 3-year on/off averages from 1988-90, 1989-91, 1990-92, and using the known values for 88, 89, 91, and 92. The fact that we have three separate 3-year-averages is great, because it means we can do a by-eye measurement multiple times and when we take the average, hopefully decrease the error. It looks like 3 -year averages are averaged using a minute-weighted average (rather than game number). I got roughly -26.5 +/- 1ish for his 1990 off-rating, but there's some uncertainty here based on how accurately I could measure by eye.

For 1995 on/off: it doesn't look like they showed the on or off rating for Jordan. I could do a ballpark-estimation here using the 3-year average like I did for 1990, but the uncertainties here would be way greater, since we get three 3-year averages to pin-down 1990's value while we only get one 3-year average to figure out what 1995 was. You'd also have to make assumptions about e.g. whether 1994 was included in the "off" rating, which is not super clear from context.

But just to be fair, here's an estimate for 1995:
( [on rating in season 1]*[on-minutes in season 1] + [on rating in season 2]*[on-minutes in season 2] + [on rating in season 3]*[on-minutes in season 3]) / ([on-minutes in season 1] + [on-minutes in season 2] + [on-minutes in season 3] ) = [3-year average on rating ].

So: 1995 on-rating estimation (with greater uncertainty from my by-eye measurement):
(7.5* 783 + 0 + x* 420)/(783 + 0 + 420) = 4.25 -> x = -1.8 on rating in 1995

Off rating for 1995 (if the 3 year average in the video included 1994 for Jordan's off rating):
(-3*(927 - 783) + (28/10)*(485 - 0) + x*(485 - 420)/(927 - 783 + 485 - 0 + 485 - 420)
-> x = +25.8 off rating in 1995 if Thinking Basketball used 1994 for the 3-year-average average off rating
-> x = +18.7 off rating in 1995 if Thinking Basketball did not use 1994 for the average off rating

so Jordan's 1995 playoff on/off is something like -16.9 to -24.0 (if my math, by-eye-measurement, and assumptions are right).

This would decrease Jordan's best 8-year average to: -13.6 to -14.2 ish. Still greater than LeBron's 8 year average, but by a less extreme margin

This is all fantastic and useful information, but there's a minor yet significant caveat: those averages are not just averages, but of consecutive year averages. Honestly, I'm not sure why consecutive averages are used so heavily in this discourse; it makes more sense to me to average the best stretches, and it makes more sense for someone like LeBron who's had some valleys amongst his monster peaks. In your consecutive calculations, you pretty much have to work around 2011 which would destroy any sample so you can't even get 2 of his best years that are right on the outside in 2010 and 2012, let alone getting to his best and second-best in 2017 and 2008 in a sample. Generally speaking, basically ALL of Jordan's best years stats-wise, advanced or otherwise, are grouped together (call it a shorter prime :wink: ). It probably makes less of a difference for something like on/off anyway, since it's reliant on so many other things where you can get poor results even in objectively great runs (see: 1992 Jordan, 2018 LeBron), but I'd say even stuff like PPG, BPM, etc. should be averaged by the best years. Frankly I'm going to chalk this up to bballref's inability to average anything except adjacent seasons, I'm not sure why they haven't implemented the option to choose which seasons to average, or maybe they do and I don't know how. When we do order by best years (only top 9 of each, ignoring 2021):

2017: 32
2008: 24.6
2012: 22.5
2010: 22.2
2007: 19.8
2016: 18.7
2020: 14.7
2009: 11.7
2014: 7.5

1990: 33.75
1989: 24
1997: 22
1996: 16
1998: 12.25
1991: 12
1993: 10.5
1988: 4.25
1992: 2

So Jordan has a small lead for best year, LeBron has an even smaller lead for second and third best, and then LeBron destroys every other year. I'm not sure about averages but these years are mostly Finals runs. The games and minutes played should be close enough where we can more or less can eyeball it, and Jordan at BEST wins probably 1yr, 2yr, and 3yr averages (maybe 4??), and it's still possible LeBron wins 2yr and 3yr when accounting for time played but I'm not sure. I'd be curious if you have a quick and simple way to get that math done :D
Good points!

Since you said you weren't sure why consecutive years were used, I think the normal explanation goes something like this:

When a stat particularly noisy (like on/off), there's a variety of things we might use to figure out the "true" signal.

1) We might use other stats (e.g. box ones) that are known to be more stable as a prior to try to "smooth out" the noisy outliers. The next questions that are obvious are which stats are best to use as priors, and how much does smoothing out outliers decrease noise vs damp the true signal. If you're interested, reading a bit more into AuPM or PIPM or any of the other composite stats might be a good start here

The other thing we can do to decrease noise is a lot simpler:
2) Use a bigger sample! Generally, the noise varies on small scales and smooths out on larger ones. The key caveat when increasing our sample is making sure we're measuring the same signal. That is, we need to make sure we're measuring the same player.

To be more explicit, 2009 LeBron is a very different player from 2013 LeBron, who's a very different player than 2016 LeBron, who's a very different player from 2020. They get their value in different ways with different skillsets! So if we're trying to pin down how valuable "young athletic-peak LeBron" is, you should only look at LeBron when he was young... you shouldn't add a signal from 2020 or 2021. Likewise, if you're trying to pin down how valuable "old, sage master LeBron" is, you should only look at LeBron when he's old... you shouldn't add a signal from 2009.

That's the reason to take consecutive averages.

Let me make this more numerical:
-Let's say one player is very consistent: his value in consecutive seasons are +10, +10, +10, +10, +10, + 10, +10, +10.
-Let's say another player is inconsistent: his value in consecutive seasons are +8, +12, +8, + 12, +8, + 12, + 8, + 12
What happens if you only take the average of the peaks of the inconsistent player? You'd say their best seasons are +12, + 12, +12, +12 compared to +10, +10, +10, +10... and conclude that Player 2 is clearly more valuable. But you'd be wrong! Their career average are exactly the same! Player 2 is just more variable.

Put simply: if you only rate a player based on their peaks and not their valleys, you're likely to overrate the player. In the plus minus data we have, LeBron is a more inconsistent player than Jordan. If you only measure their peaks and not their valleys, you're likely to overrate LeBron. The way to avoid this is to use consecutive stretches.

Edit: to make the point clearer, your sample isn't including 2011, 2013, 2015, or 2018. Those are years in the middle of his prime, so it's not like they're edge cases or anything. If there's 4 years in the middle of LeBron's prime that would all bring LeBron's average down (which they do!), then I'm not really sure we should be ignoring them. If you do ignore them, you might just be measuring the peaks while ignoring the valleys. Per my first post, Jordan looks better in 8 and 9 year samples... it's not like those are arbitrary consecutive years or anything -- Those are pretty big samples!
Djoker
Starter
Posts: 2,131
And1: 1,852
Joined: Sep 12, 2015
 

Re: What impact metrics show MJ as a GOAT candidate? 

Post#186 » by Djoker » Thu Feb 16, 2023 5:11 am

^ Great post by Draymond and really throws a wrench into the whole "Lebron dominates plus-minus" argument.

squared2020 also has Jordan's raw ON-OFF for the 1985 Playoffs vs. the Bucks. Link below:
https://squared2020.com/2022/07/31/some-michael-jordan-plus-minus-numbers/.

For the entire series:

Jordan was on the court for 171 minutes and his team was +10 so that's +2.8 per 48 minutes.
Jordan was off the court for 21 minutes and his team was -32 so that's -73.1 per 48 minutes.

That gives 1985 Jordan an ON-OFF of +75.9 per 48 minutes in the playoffs. :crazy:
DraymondGold
Senior
Posts: 596
And1: 775
Joined: May 19, 2022

Re: What impact metrics show MJ as a GOAT candidate? 

Post#187 » by DraymondGold » Thu Feb 16, 2023 5:32 am

Djoker wrote:^ Great post by Draymond and really throws a wrench into the whole "Lebron dominates plus-minus" argument.

squared2020 also has Jordan's raw ON-OFF for the 1985 Playoffs vs. the Bucks. Link below:
https://squared2020.com/2022/07/31/some-michael-jordan-plus-minus-numbers/.

For the entire series:

Jordan was on the court for 171 minutes and his team was +10 so that's +2.8 per 48 minutes.
Jordan was off the court for 21 minutes and his team was -32 so that's -73.1 per 48 minutes.

That gives 1985 Jordan an ON-OFF of +75.9 per 48 minutes in the playoffs. :crazy:
Woah :o

That's a major case of single-series playoffs (only 4 games!)... but still crazy lol

Quick google search says we also have access to a 2/3 playoff games in 1986 and 1/3 playoff games in 1987:

1986 Game 2:


1986 Game 3:


1987 Game 1:
https://www.youtube.com/playlist?list=PL6DC25DA0A95C7814

(there's also a few 30-40 min highlight vids lol)

... has anyone who's manually calculated plus minus want to give these a shot...?
Squared2020 wrote:.
I think I remember seeing you've stopped doing your (fantastic) research, but just in case you haven't and are looking for new games, I found these! Regardless, hope all's well Squared2020 :D
Bidofo
Pro Prospect
Posts: 776
And1: 975
Joined: Sep 20, 2014
     

Re: What impact metrics show MJ as a GOAT candidate? 

Post#188 » by Bidofo » Thu Feb 16, 2023 7:08 am

DraymondGold wrote: Good points!

Since you said you weren't sure why consecutive years were used, I think the normal explanation goes something like this:

When a stat particularly noisy (like on/off), there's a variety of things we might use to figure out the "true" signal.

1) We might use other stats (e.g. box ones) that are known to be more stable as a prior to try to "smooth out" the noisy outliers. The next questions that are obvious are which stats are best to use as priors, and how much does smoothing out outliers decrease noise vs damp the true signal. If you're interested, reading a bit more into AuPM or PIPM or any of the other composite stats might be a good start here

The other thing we can do to decrease noise is a lot simpler:
2) Use a bigger sample! Generally, the noise varies on small scales and smooths out on larger ones. The key caveat when increasing our sample is making sure we're measuring the same signal. That is, we need to make sure we're measuring the same player.

To be more explicit, 2009 LeBron is a very different player from 2013 LeBron, who's a very different player than 2016 LeBron, who's a very different player from 2020. They get their value in different ways with different skillsets! So if we're trying to pin down how valuable "young athletic-peak LeBron" is, you should only look at LeBron when he was young... you shouldn't add a signal from 2020 or 2021. Likewise, if you're trying to pin down how valuable "old, sage master LeBron" is, you should only look at LeBron when he's old... you shouldn't add a signal from 2009.

That's the reason to take consecutive averages.

We agree on the quest for larger samples, but I'm still unconvinced of consecutive samples being especially important, and this may be a more philosophical thing. I'm going to move this towards a more CORP-related approach since the idea still holds over from the on/off data and it seems like we're getting there anyway. What value is there in separating the stages of a player when we want an idea of what they are like at their BEST? If I was looking to divide both players in the same light, then it makes sense to compare young and upcoming LeBron vs young and upcoming Jordan, and then eventually twilight LeBron vs twilight Jordan, but that wasn't really the intent of my on/off ordering. A +10 LeBron season while he's young, athletic, and overwhelmingly a slasher is effectively equivalent to a +10 LeBron season when he's older, more methodical, and jumper-oriented. Maybe some calculation should be done to quantify their portability, but that's relatively minor and each version has its own myriad of pros and cons relative to another. Quick aside back to the on/off stuff, the surrounding factors for LeBron are way more variable than they are for Jordan: a bunch of roster turnover from changing teams, injuries, and numerous coaches and systems make using consecutive stretches less valuable anyway. 90-93 and 96-98 are two INCREDIBLY consistent stretches on that front. The best you can find for LeBron is probably 11-13 and 16-17. That's not to say this wouldn't impact individual season CORP too, but we attempt to at least dilute it down to a single number relatively independent on those surrounding factors.
DraymondGold wrote:Let me make this more numerical:
-Let's say one player is very consistent: his value in consecutive seasons are +10, +10, +10, +10, +10, + 10, +10, +10.
-Let's say another player is inconsistent: his value in consecutive seasons are +8, +12, +8, + 12, +8, + 12, + 8, + 12
What happens if you only take the average of the peaks of the inconsistent player? You'd say their best seasons are +12, + 12, +12, +12 compared to +10, +10, +10, +10... and conclude that Player 2 is clearly more valuable. But you'd be wrong! Their career average are exactly the same! Player 2 is just more variable.

Well that's not the conclusion I'd make at all. The only thing I would say is that for their 7 best or less seasons, player 2 grades out as the better player on average, which is clearly true. I'm not making a conclusion on both of their entire careers based solely on a limited set of their data. And we can easily see an example of the opposite approach being misleading as well:
-Player 1: +10, +10, +10, +10, +10, + 10, +10, +10
-Player 2: +8, +12, +0, +0, +0, +0, +12, +0, +8, +0, +0, +8, +12, +0, +8, +0, +12
Now those 0s could be for a bunch of different reasons like wrong fit, maybe a bad back really limits them :wink: , but any consecutive year average is grossly going to underrate player 2, when really they are still equally valuable. The conclusion I would make is still true, <7 season average has player 2 on top. I'd say this extreme example is more fitting of the Jordan vs LeBron arc, except change some of those 0s into a (completely arbitrary) +3 and suddenly player 2 becomes the obviously more valuable career, which might get lost in the woods when looking at just consecutive averages.

DraymondGold wrote:Put simply: if you only rate a player based on their peaks and not their valleys, you're likely to overrate the player. In the plus minus data we have, LeBron is a more inconsistent player than Jordan. If you only measure their peaks and not their valleys, you're likely to overrate LeBron. The way to avoid this is to use consecutive stretches.

Edit: to make the point clearer, your sample isn't including 2011, 2013, 2015, or 2018. Those are years in the middle of his prime, so it's not like they're edge cases or anything. If there's 4 years in the middle of LeBron's prime that would all bring LeBron's average down (which they do!), then I'm not really sure we should be ignoring them. If you do ignore them, you might just be measuring the peaks while ignoring the valleys. Per my first post, Jordan looks better in 8 and 9 year samples... it's not like those are arbitrary consecutive years or anything -- Those are pretty big samples!

The thing is LeBron's longevity allows us to compare his best 9 seasons to Jordan's ENTIRE prime of 9 seasons and see how they stack up. Those valleys I didn't include weren't being "ignored" exactly, just pushed to the end. If a player is going to dominate a statistic, then they should be able to prove that at their best.

In any case, I think the conflating of CORP and the original on/off is getting confusing; they're not exactly the same thing since you ideally add up one and average the other. But you were right in that my original response, I WAS just measuring the peaks. An average of a very lengthy and variable prime is going to lead to wonky results, like I said you have two elite values sitting on opposite ends of by FAR the worst value in the set.
User avatar
AEnigma
Assistant Coach
Posts: 4,130
And1: 5,973
Joined: Jul 24, 2022
 

Re: What impact metrics show MJ as a GOAT candidate? 

Post#189 » by AEnigma » Thu Feb 16, 2023 10:25 am

Yeah some of these numbers are not correct. I guess you can blame Ben’s per 48 decision for that, or Basketball-Reference’s questionable on/off measurements, but whatever the reason, there is a pretty notable disconnect from replicating the process used for Jordan’s on/off (point differential and minutes).

LeBron has better playoff on/off in 1 year (but only because of an outlier single-series playoffs in 2021; Jordan's ahead otherwise)

Willing to throw out a single series on its own (although we will come back to this…). However, 2017 is not +32 per 48 minutes, it is +33.4 — which I would say is right in the margin of error for Jordan’s 1990, although if someone wants to say Jordan has a slim edge here, that is fine.

Jordan has better playoff on/off in 2 years

Correct, but worth noting Lebron actually has two comparable two-year samples: 2007/08 (+25.8 per 48 minutes) and the identified 2016/17 (+24.9 per 48 minutes by my numbers, but at least the value is close).

Jordan has better playoff on/off in 3 years

Correct, although 2007-09 is right on par with 2008-10 as a young sample, with more games and minutes played.

Jordan has better playoff on/off in 4 years

Incorrect. Lebron’s 2007-10 is +21 per 48 (and probably should be similar even with the pbp/bbr method). No good excuse to have missed that.

LeBron has better playoff on/off in 5 years (but only because of an outlier single-series playoffs in 2021; Jordan's ahead otherwise)

This is disingenuous. The 2016-21 sample covers 88 games, while the 1989-93 sample covers 91 games. Just because it is inconvenient does not mean you get to toss it out (more on that later too). Also, Jordan’s value is mislabeled here. Ben gave us the graphs for this frame, so everyone should have immediately noticed this particular disconnect if they were paying attention.

Jordan has better playoff on/off in 6 years

No, we do not get to just skip 1995 and move on to 1996, that is nonsensical even if the data is a bit fuzzier. Bad form. Beyond that, Lebron’s 2012-17 stretch should be +14.7 per 48 minutes, and then the 2015-21 stretch (unlisted…) should be +16 per 48 minutes — which is of course also higher than Jordan’s 1988-93 stretch. Additionally, Lebron’s 2007-12 stretch should be +15.4 per 48 minutes, so that is two completely distinct six-year periods topping Jordan’s 1988-93 (so much for consistency).

Jordan has better playoff on/off in 7 years (but LeBron comes out ahead if we include 1995 which has greater uncertainty)

Again, Jordan does not get to skip 1995 because “oh it is tough to tell whether it is abysmal for him or merely awful.” If the goal is to shield Jordan, then I would sooner argue that Jordan’s 1987 likely fares better (would be tough to fare worse). But even then, Lebron’s 2014-21 should be +14.9 per 48, and that is over a 128-game sample (so no, 2021 stays).

Jordan has better playoff on/off in 8 years

Yet again, Jordan does not get to skip over 1995. Still an argument for Jordan over this frame, although I would say it is within the margin of error considering that Lebron caps out at +13.1 per 48 minutes while drawing from an extra thirty games of data.

Jordan has better playoff on/off in 9 years

Once more, no tossing 1995. Increasingly questionable that even with what I will nicely assume is an honest mistake in calculating Lebron’s values, and with Jordan having that peak edge people like so much, it was apparently still necessary to further manipulate the data to benefit Jordan. Anyway, Lebron’s 2012-21 sample should be +14.4 per 48 minutes — right in line with that 1988-93 Jordan sample, with over seventy games extra.

Which leaves is with actual distribution of:
1-year — Relatively even but with margin toward Jordan
2-year — Jordan, although Lebron has two similarly strong samples a decade apart.
3-year — Jordan
4-year — Lebron
5-year — Lebron (which we already knew…)
6-year — Lebron
7-year — Lebron (including when using Jordan’s six-year sample)
8-year — Relatively even but with margin toward (a smaller sample) Jordan
9-year — Lebron (including when using Jordan’s six-year sample)

Oh, and since there is so much talk about consistency, probably worth mentioning that Lebron’s 2007-21 postseason on/off per 48 minutes is still +13.8.
MyUniBroDavis wrote:Some people are clearly far too overreliant on data without context and look at good all in one or impact numbers and get wowed by that rather than looking at how a roster is actually built around a player
Djoker
Starter
Posts: 2,131
And1: 1,852
Joined: Sep 12, 2015
 

Re: What impact metrics show MJ as a GOAT candidate? 

Post#190 » by Djoker » Thu Feb 16, 2023 6:52 pm

When comparing peaks it makes no sense to use multiple non-overlapping samples. For example if you choose 2017 Lebron as his 1-year peak then that year should be included in his best 2-year sample which is 2016-2017. And then both those years should be included in his best 3-year sample which is 2015-2017. And so on...

Having more good plus-minus postseasons (more postseasons in general...) is credit to Lebron's longevity but in peak stretches ranging from 1-year to 10-year, Jordan has the clear edge. And Jordan is almost certainly leading in career playoff ON-OFF since we are only missing data for 1986 and 1987 playoff Jordan which is a total of 6 games and won't really affect the numbers in any direction.
OhayoKD
Head Coach
Posts: 6,042
And1: 3,930
Joined: Jun 22, 2022
 

Re: What impact metrics show MJ as a GOAT candidate? 

Post#191 » by OhayoKD » Thu Feb 16, 2023 8:24 pm

Welp.
AEnigma wrote:Yeah some of these numbers are not correct. I guess you can blame Ben’s per 48 decision for that, or Basketball-Reference’s questionable on/off measurements, but whatever the reason, there is a pretty notable disconnect from replicating the process used for Jordan’s on/off (point differential and minutes).

For posterity...
Bidofo wrote:

Bad Gatorade wrote:

ShaqAttac wrote:

Dray's on/off calculations had significant inaccuracies. Post #189 has most of the corrections. FWIW, here's some further fixes to Dray's data from 07, 08, 10, and 12(over a sample of 67 playoff games)

2007:+21.3
2008:+31.2
2010:+25.8
2012:+22.9

Fwiw, that correction boosts Lebron even more giving him 2 6-year stretches that top any of Jordan's

Applying this more accurate data(>1 playoff series minimum so no 2021 :cry: )...
I'm not sure on/off is actually so favorable to LeBron... Jordan arguably looks better than LeBron in playoff on/off.


Using the "consecutive year average" method(For you Dray)

1-year - Tie
2-year - Jordan(Lebron has two comparable stretches)
3-year - Jordan(Lebron has two comparable stretches)
4-year - Lebron
5-year - Lebron(big-gap)
6-year - Lebron(bigger-gap, 2 separate samples score higher than any of MJ's)
7-year - Lebron(better than even a 6-year Jordan sample)
8-year - Tie
9-year - Lebron(better than even a 6-year Jordan sample)


Using the "average the best years" method(For you Bidolfo)

1-year - tie
2-year - Lebron
3-year - Lebron
4-year - Lebron
5-year - Lebron
6-year - Lebron
7-year - Lebron
8-year - Lebron
9-year - Lebron

TLDR: https://youtu.be/_MBgz9h7GGM?t=23
In the plus minus data we have, LeBron is a more inconsistent player than Jordan.

Lebron's 2007-2021 (that's 14-years) matches Jordan's best best 8-year stretch. Maybe you have a different definition of "consistency" than the rest of us? :wink:

Also, since you're concerned about team-context, here's 2 caveats to consider.

1. Lebron is, generally, playing significantly more minutes and games over the stretches we're comparing. Averages tend to go down, the longer someone plays.
2. Lebron generally staggered more with his co-stars than Jordan did. Typically this would depress a player's on/off. All things considered, "team context" probably juices Jordan, not Lebron.

Maybe #2 is why lineup-adjustment puts Lebron's 8-year average higher than the very best 1-year signal we have for Mike. Truly inconsistent.
its my last message in this thread, but I just admit, that all the people, casual and analytical minds, more or less have consencus who has the weight of a rubberized duck. And its not JaivLLLL
User avatar
AEnigma
Assistant Coach
Posts: 4,130
And1: 5,973
Joined: Jul 24, 2022
 

Re: What impact metrics show MJ as a GOAT candidate? 

Post#192 » by AEnigma » Thu Feb 16, 2023 9:39 pm

Djoker wrote:When comparing peaks it makes no sense to use multiple non-overlapping samples. For example if you choose 2017 Lebron as his 1-year peak then that year should be included in his best 2-year sample which is 2016-2017. And then both those years should be included in his best 3-year sample which is 2015-2017. And so on...

That presupposes that 1) we assess peaks by which year has the best number of choice and then move from there, and 2) that a player is better of they cleanly follow a set arc rather than go through various (often contextual) highs and lows. Again, the goal is not who hits the best story beats of rise, climax, fall. Why would penalise Lebron because he rudely just kept going up and down for over a decade rather than clearly marking, “This is me at at best, everything surrounding this point is worse proportionally.”

Kareem’s arc is not clean. Duncan’s arc past two-years is not clean. Hakeem has ups and downs, although yes a reasonably clear two-to-three-year peak. Wilt’s arc had massive swings.

But to that point, are you even sure you want to commit to the implication of your argument? Many of us have held that Jordan peaked in 1990 but just had worse competition and a better team in 1991; do you believe that? Or should we be starting with 1991 here first? Guess what happens to your one and two-year peaks relative to 2016/17 Lebron (a minority peak choice, but much less of one than any non-1991 choice for Jordan).

More realistically, you just want to twist whatever you see in a way that advances your Jordan stances. None of this data mattered to you… until it suddenly did.

Having more good plus-minus postseasons (more postseasons in general...) is credit to Lebron's longevity but in peak stretches ranging from 1-year to 10-year, Jordan has the clear edge.

Only if you use incorrect data for Lebron.

And Jordan is almost certainly leading in career playoff ON-OFF since we are only missing data for 1986 and 1987 playoff Jordan which is a total of 6 games and won't really affect the numbers in any direction.

Mm would not go that far, but that goes back to penalising Lebron for playing longer. What if Jordan made the playoffs in 2002 and then had a terrible on/off; is he suddenly a worse player? Fourteen years, Lebron is pretty well-situated relative to Jordan. Maybe those Celtics series could skew the advantage more demonstrably to Jordan, and maybe they would not. If they did hurt him, I doubt you would care (or remember how vehemently you insisted 1986 was his prime, no question…). But it would be because of his own reduced sample. If Shaq had retired after 2004, his career postseason data would look stronger, but I would would not value him more. And if postseason data for Bird or Magic revealed a better average than Jordan, somehow I doubt you would be rushing to elevate them above.

Using the "average the best years" method

Not the biggest fan of this approach, although it is an interesting way to offset those who try to pretend longevity is irrelevant.

If we want to look at brief peaks in that way, I personally think it is more fun to highlight series. :lol: Lebron was +28.3 (ooh the comeback number) per 48 minutes in the 2016 Finals. Personally care more about that than about 2021. :wink:
MyUniBroDavis wrote:Some people are clearly far too overreliant on data without context and look at good all in one or impact numbers and get wowed by that rather than looking at how a roster is actually built around a player
DraymondGold
Senior
Posts: 596
And1: 775
Joined: May 19, 2022

Re: What impact metrics show MJ as a GOAT candidate? 

Post#193 » by DraymondGold » Thu Feb 16, 2023 10:03 pm

AEnigma wrote:Yeah some of these numbers are not correct. I guess you can blame Ben’s per 48 decision for that, or Basketball-Reference’s questionable on/off measurements, but whatever the reason, there is a pretty notable disconnect from replicating the process used for Jordan’s on/off (point differential and minutes).

LeBron has better playoff on/off in 1 year (but only because of an outlier single-series playoffs in 2021; Jordan's ahead otherwise)

Willing to throw out a single series on its own (although we will come back to this…). However, 2017 is not +32 per 48 minutes, it is +33.4 — which I would say is right in the margin of error for Jordan’s 1990, although if someone wants to say Jordan has a slim edge here, that is fine.

Jordan has better playoff on/off in 2 years

Correct, but worth noting Lebron actually has two comparable two-year samples: 2007/08 (+25.8 per 48 minutes) and the identified 2016/17 (+24.9 per 48 minutes by my numbers, but at least the value is close).
OhayoKD wrote:Welp.
AEnigma wrote:Yeah some of these numbers are not correct. I guess you can blame Ben’s per 48 decision for that, or Basketball-Reference’s questionable on/off measurements, but whatever the reason, there is a pretty notable disconnect from replicating the process used for Jordan’s on/off (point differential and minutes).

For posterity...
Bidofo wrote:

Bad Gatorade wrote:

ShaqAttac wrote:

Dray's on/off calculations had significant inaccuracies. Post #189 has most of the corrections. FWIW, here's some further fixes to Dray's data from 07, 08, 10, and 12(over a sample of 67 playoff games)

2007:+21.3
2008:+31.2
2010:+25.8
2012:+22.9

Fwiw, that correction boosts Lebron even more giving him 2 6-year stretches that top any of Jordan's
Enigma forgot to leave any sources so that people aren't able to verify the corrections,

but...

they line up pretty exactly with PBPStats' on/off ratings which are per 100 possesions, not per 48 minutes (https://www.nba.com/stats/help/glossary), with multi-year-samples averaged by the year. Which would mean Enigma is comparing LeBron's per 100 possessions on/off with Jordan's per 48 minutes on/off, which would be both incorrect and systematically biased towards LeBron, as per 100 possessions inflate numbers vs per 48 minutes.

If either of you have a source for the accurate on/off per 48 minutes, I'm all ears! Basketball Reference doesn't give many significant figures at all for the per possession vs per minute numbers, so it's certainly possible that a rounding error could accumulate. As I said in my post, I averaged multi-year samples per-game rather than per-minute, which account for the difference between my values and Ben's values. I did it simply because it was faster to calculate, but it's fairly simple (if slightly more time consuming) for one of y'all to calculate the multi-year minute-weighted average.

But it would be nice to confirm that you're not just using PBPStats... as those would be in the wrong units if you are
Djoker
Starter
Posts: 2,131
And1: 1,852
Joined: Sep 12, 2015
 

Re: What impact metrics show MJ as a GOAT candidate? 

Post#194 » by Djoker » Thu Feb 16, 2023 10:48 pm

Basketball-Reference does have all the ON and ON-OFF playoff data for Lebron.

Image

It's per 100 possessions but that's very easy to convert to per 48 minutes.

AEnigma wrote:A


Because we are comparing primes. You're just upset that Jordan has better numbers! :lol:

For the record, I don't even consider plus-minus stats to be the end-all-be-all because they are lineup stats at the end of the day.

All it shows is that there is a bigger gap between 5-man lineups with Jordan and without Jordan than between 5-man lineups with Lebron and without Lebron. And against completely different opposition as well.
User avatar
AEnigma
Assistant Coach
Posts: 4,130
And1: 5,973
Joined: Jul 24, 2022
 

Re: What impact metrics show MJ as a GOAT candidate? 

Post#195 » by AEnigma » Thu Feb 16, 2023 10:49 pm

Sad when people try to double down on incorrect numbers. What exactly was your process, Draymond. You gestured at adjusting basketball-reference and pbpstats, but that does not mean anything. And now you want to portray being similar to PBPStats as lifting directly from it.

I said what I did here.
replicating the process used for Jordan’s on/off (point differential and minutes).

I am curious what you think is done when people hand-track plus/minus. There is no “source”, you do the work yourself. But rather than engage with that, per usual resorted to pouting and projecting your own attempts to cook data toward Jordan onto everyone else. So much for trying to take a neutral stance.
MyUniBroDavis wrote:Some people are clearly far too overreliant on data without context and look at good all in one or impact numbers and get wowed by that rather than looking at how a roster is actually built around a player
User avatar
AEnigma
Assistant Coach
Posts: 4,130
And1: 5,973
Joined: Jul 24, 2022
 

Re: What impact metrics show MJ as a GOAT candidate? 

Post#196 » by AEnigma » Thu Feb 16, 2023 10:53 pm

Djoker wrote:Basketball-Reference does have all the ON and ON-OFF playoff data for Lebron.

Image

It's per 100 possessions but that's very easy to convert to per 48 minutes.

That is not the same process as what was done for Jordan.

AEnigma wrote:A

Because we are comparing primes. You're just upset that Jordan has better numbers! :lol:

“I’m not mad, you are!”

Lebron’s prime covering Jordan’s entire Bulls career is not his shortcoming lmao.

For the record, I don't even consider plus-minus stats to be the end-all-be-all because they are lineup stats at the end of the day.

All it shows is that there is a bigger gap between 5-man lineups with Jordan and without Jordan than between 5-man lineups with Lebron and without Lebron. And against completely different opposition as well.

Yep, and Lebron faced more high end opposition. :dontknow:
MyUniBroDavis wrote:Some people are clearly far too overreliant on data without context and look at good all in one or impact numbers and get wowed by that rather than looking at how a roster is actually built around a player
User avatar
Heej
General Manager
Posts: 8,469
And1: 9,170
Joined: Jan 14, 2011

Re: What impact metrics show MJ as a GOAT candidate? 

Post#197 » by Heej » Fri Feb 17, 2023 5:23 am

rk2023 wrote:How is this thread still going one month later lol. FS1 may be debuting a new talk-show incase any of you are intrigued. Seems like this thread would be the right place to ask :lol: :lol:

That's because this thread is probably the best thread I've seen on RealGM as far as actual high level and fun basketball discourse. As a bystander this is like watching the 2017 Finals, seeing all the great back and forth. I'm much more of a film guy than stats and stuff so it's really interesting seeing what the latest and greatest stats say.

Some things I wanna add. Re: Wade discussion. People knock LeBron for not synergizing as well with him as he did with Pippen. But it seems people don't remember what they looked like when they were clicking on all cylinders during the 27 game win streak. Unfortunately Wade got injured against Boston during it and it was all downhill for the Heat from there.

Something interesting that I've thought ever since watching KD fit in on the 2017 Warriors and devouring all of the Post-Game press conferences and articles during that time; the idea of communication on the court is severely undervalued by fans and it appears there's something being captured here with these freakish LeBron on/off numbers that seems to break people's brains so they resort to blaming him for some reason because he shouldn't be breaking their conception of basketball like this.

But it's very simple what I realized after watching what KD was able to do. Some of the interviews from that time (Kerr comes to mind) talked about how KD was able to take his mind off running the offense or quarterbacking the defense and focus completely on his individual assignments and game plan. Because he had the luxury of running alongside Steph and Draymond who both functioned as the brains of the offense and defense respectively (arguably one could say Draymond is the true quarterback of both, but I'm gonna leave that one alone for now).

Highly reminiscent of what Phil wrote in Eleven Rings about Scottie being the quarterback and middle linebacker for offense and defense, being the guy who bore mental load of running the offense and getting people in their spots on defense and directing people. This allowed MJ to singularly focus on getting buckets as well as following his own defensive plan alongside the common Jordan steal improvisations. When you play, it can't be overstated how draining and constricting it is to be the guy responsible for rhe majority of the communication on the floor for one end, let alone both ends.

Which is what makes LeBron so incredible because he's been the control tower on offense and defense for damn near his entire career. We've had coaches and teammates describe him as a coach on the floor. There was an article during the 2018 Finals I remember where JR Smith said LeBron's communication on the floor legitimately makes everyone one step faster on defense. And this is something he doesn't get nearly enough credit for. But this is a big deal to people who are actually in the game and around the game, because one of the major talking points about the Lakers acquiring Rondo for LeBron was about how helpful it would be for LeBron to have someone else think the game for him and organize sets and get guys to their spots.

Jordan always had that luxury with Pippen. I can't say the same at all about LeBron, and I can guarantee this factor plays a huge role in his on/off numbers as well just because it's actually pretty rare for your straight up best player to be your best communicator on both ends. We all saw how easy it came to LeBron when he shut his brain off and went for Kareem's record that night vs OKC. Effortlessly dropped 38 points in 3 quarters :lol:.

The fact that he's absorbing that responsibility on top of everything else on his teams is a huge reason why he's so portable and scalable to damn near any kind of offensive or defensive system, and this appears to be something impact stats are catching and crediting him for; while most casuals will look at this and only try to conjure up low IQ takes where LeBron saps his teammates playing abilities when he's on the bench. Maybe, just maybe, there's more to him as a player and the bedrock foundation he provides to a team beyond "he do da ballhog gud"
LeBron's NBA Cup MVP is more valuable than either of KD's Finals MVPs. This is the word of the Lord
OhayoKD
Head Coach
Posts: 6,042
And1: 3,930
Joined: Jun 22, 2022
 

Re: What impact metrics show MJ as a GOAT candidate? 

Post#198 » by OhayoKD » Fri Feb 17, 2023 9:23 am

Heej wrote:
rk2023 wrote:Highly reminiscent of what Phil wrote in Eleven Rings about Scottie being the quarterback and middle linebacker for offense and defense, being the guy who bore mental load of running the offense and getting people in their spots on defense and directing people. This allowed MJ to singularly focus on getting buckets as well as following his own defensive plan alongside the common Jordan steal improvisations. When you play, it can't be overstated how draining and constricting it is to be the guy responsible for rhe majority of the communication on the floor for one end, let alone both ends.

Which is what makes LeBron so incredible because he's been the control tower on offense and defense for damn near his entire career. We've had coaches and teammates describe him as a coach on the floor. There was an article during the 2018 Finals I remember where JR Smith said LeBron's communication on the floor legitimately makes everyone one step faster on defense. And this is something he doesn't get nearly enough credit for. But this is a big deal to people who are actually in the game and around the game, because one of the major talking points about the Lakers acquiring Rondo for LeBron was about how helpful it would be for LeBron to have someone else think the game for him and organize sets and get guys to their spots.

Do you have the eleven rings quote on hand? As it is, "communication" or "backseat coaching" is one of those things which has a sizable benefit for a team when a player is off-the-court. So really the effect here wouldn't really be captured by the raw numbers, on/off or otherwise. Guys like Dray, Lebron, KG, and naturally, Russell probably deserve some bonus consideration for what they do as orchestrators.

Not that Lebron needs that(see above :lol: )
its my last message in this thread, but I just admit, that all the people, casual and analytical minds, more or less have consencus who has the weight of a rubberized duck. And its not JaivLLLL
User avatar
Heej
General Manager
Posts: 8,469
And1: 9,170
Joined: Jan 14, 2011

Re: What impact metrics show MJ as a GOAT candidate? 

Post#199 » by Heej » Fri Feb 17, 2023 2:15 pm

OhayoKD wrote:
Heej wrote:
rk2023 wrote:Highly reminiscent of what Phil wrote in Eleven Rings about Scottie being the quarterback and middle linebacker for offense and defense, being the guy who bore mental load of running the offense and getting people in their spots on defense and directing people. This allowed MJ to singularly focus on getting buckets as well as following his own defensive plan alongside the common Jordan steal improvisations. When you play, it can't be overstated how draining and constricting it is to be the guy responsible for rhe majority of the communication on the floor for one end, let alone both ends.

Which is what makes LeBron so incredible because he's been the control tower on offense and defense for damn near his entire career. We've had coaches and teammates describe him as a coach on the floor. There was an article during the 2018 Finals I remember where JR Smith said LeBron's communication on the floor legitimately makes everyone one step faster on defense. And this is something he doesn't get nearly enough credit for. But this is a big deal to people who are actually in the game and around the game, because one of the major talking points about the Lakers acquiring Rondo for LeBron was about how helpful it would be for LeBron to have someone else think the game for him and organize sets and get guys to their spots.

Do you have the eleven rings quote on hand? As it is, "communication" or "backseat coaching" is one of those things which has a sizable benefit for a team when a player is off-the-court. So really the effect here wouldn't really be captured by the raw numbers, on/off or otherwise. Guys like Dray, Lebron, KG, and naturally, Russell probably deserve some bonus consideration for what they do as orchestrators.

Not that Lebron needs that(see above :lol: )

Unfortunately the book is at my parent's house and I haven't been able to find any PDFs like that. I can leave you with this quote talking about just his defense from an article a decade ago:

“His greatest strength was his knowledge of how things worked on the defensive end of the floor,” he said. “Scottie was the voice of our team—figuratively and literally, as he did a lot of the talking and kept our team on the same page. When he wasn’t at the top of the key harassing a guard as a special assignment, he was on the backside of our defense talking his teammates through different situations, whether it was a double team, trap or some other important aspect. Because of that, he was very vital to the run that we made.”

https://www.nba.com/bulls/history/pippenhof_jackson_100730.html

I'll probably have to get the book and save the exact quote myself where he talks about Scottie on both ends because I'm sure it'll be useful in future discussions lol. Specifically remember him saying Scottie was the guy that told everyone where to go in the triangle in that book. As far as your point about communicating from the bench carrying over, that's true; but it's still different when you're on the floor with someone imo. It might only be a few feet of difference but sometimes it really does feel like there's a forcefield between you and the off the court bench guys and coaches talking. The stuff they're saying just doesn't carry as well as the on floor guys idk. It's weird.

Still tho, don't think Jordan had that in him to really be able to orchestrate on both ends of the floor; and that's partly why he needed Pippen and Phil more than people like to admit. Also seems to contribute to why a lot of these impact numbers need to be heavily massaged in order to prop Jordan up vs LeBron lol
LeBron's NBA Cup MVP is more valuable than either of KD's Finals MVPs. This is the word of the Lord
User avatar
SideshowBob
General Manager
Posts: 9,062
And1: 6,267
Joined: Jul 16, 2010
Location: Washington DC
 

Re: What impact metrics show MJ as a GOAT candidate? 

Post#200 » by SideshowBob » Fri Feb 17, 2023 2:57 pm

I'm enjoying the dialogue in this thread. I kinda hope it persists forever.
But in his home dwelling...the hi-top faded warrior is revered. *Smack!* The sound of his palm blocking the basketball... the sound of thousands rising, roaring... the sound of "get that sugar honey iced tea outta here!"

Return to Player Comparisons