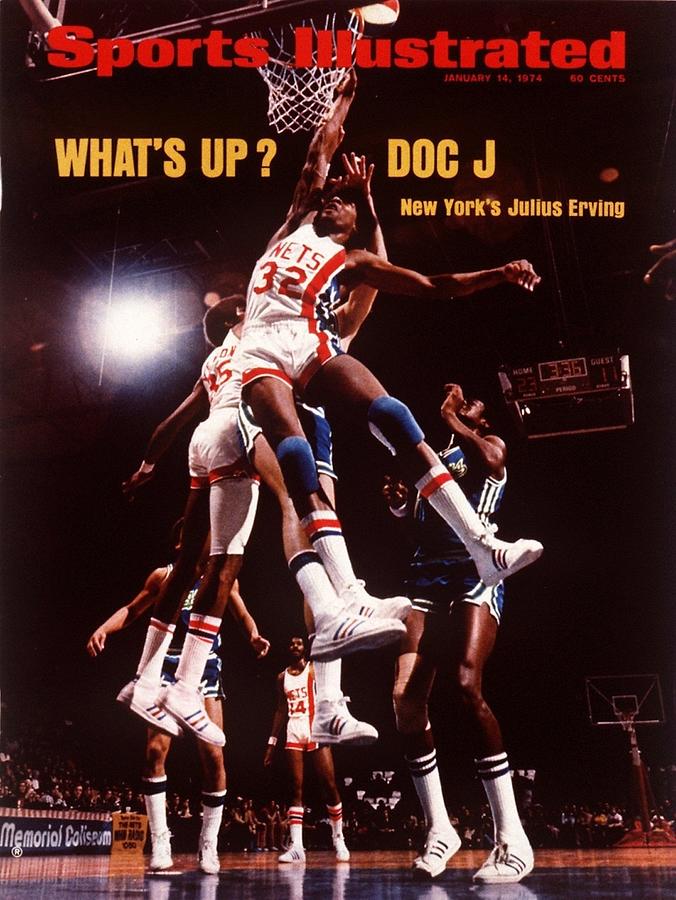
OldSchoolNoBull wrote:This whole conversation is trying to determine how much it matters that CP3 appears to fall off during the course of a series? Do I have that right?
I have no answer to that, but I will say that I'm not as high on CP3 as some of you, and that in comparing three PGs who seems likely to come up in the near future - CP3, Nash, and Stockton - that I am probably in the minority in that I would take Stockton over the others.
RS / PS career rTS averages:
Stockton: +7.6 / +3.6
Paul: +3.5 / +3.6
Nash: +7.5 / +5.3
Both Stockton and Nash are much more efficient during the larger sample of the regular season than CP3, with Nash being the most efficient in the post-season. They are both 4+ percentage points ahead of CP3 in the RS. Yes, Stockton falls the most in the PS, but +3.6 is still solid PS efficiency and there's no getting around CP3's RS deficiency.
Nash is the most efficient overall of the three, but of course his (lack of) defense hurts his case.
Career average DRAPMs:
Stockton: 1.77(11 seasons, JE RS+PS and Squared2020)
Paul: 0.94(14 seasons, JE RS+PS, I don't have his RAPMs post-2019)
Nash: -0.78(18 seasons, JE RS+PS)
Stockton's defense impact grades out well ahead of CP3, while Nash's is predictably much worse than either.
Career Average Turnover Economy PER 100 Possessions:
Some of you have lauded CP3 for being goat-tier in this category, and that's true, but Stockton seems to be right there with him.
Stockton: 16.8/4.5(3.73) RS, 15.4/4.3(3.58) PO
Nash: 13.8/4.7(2.94) RS, 12.8/4.6(2.78) PO
Paul: 14.1/3.5(4.03) RS, 11.6/3.6(3.22) PO
CP3 indeed leads in the RS, but Stockton is in the ballpark, just .3 behind in assist/turnover ratio. And in the playoffs, Stockton actually leads by a similar margin.
Career RS/PS On/Off
Stockton has superior on/off in RS and PS to both. Though I acknowledge that we only have on/off from 1997 onwards and that it's possible Stockton's numbers would lower if we had all the data. I'm not entirely sure of that though.
Stockton: +10.8 / +7.9
Nash: +7.0 / +4.7
Paul: +9.6 / +6.2
Durability:
Career average games played per season:
Stockton: 79.2
Nash: 67.6
Paul: 67.4
Total number of career playoff games missed / total number of playoff games played by team
Stockton: 0/182
CP3: 12/161(all 2015 and later)
Nash: 3/123
In conclusion, I just think Stockton is the most complete player of the three with the fewest holes - more efficient than CP3 by a wide margin in the regular season, better defender than Nash(than both, actually, by DRAPM), more durable than both, highest on/off, etc.
Given the sheer impact of Nash's offensive game - beyond his individual efficiency, his teams had an average rORtg of +4.66 over his 18 seasons vs CP3's teams having an average of +2.49 over his 18 seasons so far, with 6 #1 finishes and 9 consecutive Top 2 finishes vs CP3's 3 #1 finishes and 4 Top 2 finishes - I might be tempted to take him over CP3 as well despite the defensive gap. This is also the one area where Stockton lags behind both.
The 2022 and 2023 isn't in the database yet, so it can't be counted. However, if we look at CP3's 14 PS from 08-21, it does not show him to be an inferior player to Stockton on a per-game basis.
CP3 from 08-21 in the PS averaged an adjusted 22.7 pts per 75 on rTS% of 4.4%
Stockton from 86-99 in the PS (Stockton I don't think played enough MPG to be picked up in the Backpicks database, however, this ends up helping his PS averages) averaged an adjusted 16.5 pts per 75 on rTS% of 5.3%.
So Stockton maintains the efficiency advantage, however he is also scoring 5.7 pts less per 75 possessions in exchange for +1.3% of efficiency. Philosophically, if the much higher volume is worth may come down to preference, however, I will generally people favor Kobe and Hakeem as scorers over CP3, so I would say the same should extend to be true for CP3 being over Stockton in this case.
According to PS ScoreVal during those spans, CP3's scoring looks more valuable:
CP3 ScoreVal-0.7
Stockton ScoreVal-0.3
CP3's general PS metrics do look better as well:
Backpicks BPM-5.7
PER-23.7
BPM-7.1
WS/48-.193
Compared to Stockton
Backpicks BPM-5.3
PER-20.1
BPM-6.3
WS/48-.163
It's not just the PS either. Paul's RS play looks better on a per-possession basis too.
Paul
Adjusted 21.3 pts per 75 (rTS% of 4.3%)
PIPM-5.7
PER-25.3
BPM-7.8
WS/48-.251
Stockton
Adjusted 16.3 pts per 75 (rTS% of 7.9%)
PIPM-5
PER-22.2
BPM-7.4
WS/48-.214
Both Paul and Stockton have playstyles that are generally pretty well represented by the box-score and full encapsulates what they bring to the table. Even with Stockton's RS efficiency advantage, the numbers don't suggest that Stockton's lower volume was preferential to Paul. I think it is fair to argue Stockton's durability helps in a comparison to Paul, however, I certainly don't get the impression that Stock is a better basketball player than Paul.
We also have numbers heavily using the on/off and plus-minus from we have from 97 onward. And while Stockton looks great, none of the numbers suggests he surpassed Paul's peak years in this regard. I don't doubt younger Stockton might look better in his younger years, but that is more of a projection than a certainty.


/cdn.vox-cdn.com/uploads/chorus_asset/file/9113427/GettyImages_1821652.0.jpg)