Djoker wrote:It's based on Squared2020's extensive logging of regular seasons before the PBP era. Some of you may recognize the format because the original post of this kind was done by colts18 here and it had a sample of 157 games based on just the top 50 lineups.
viewtopic.php?f=64&t=2323051
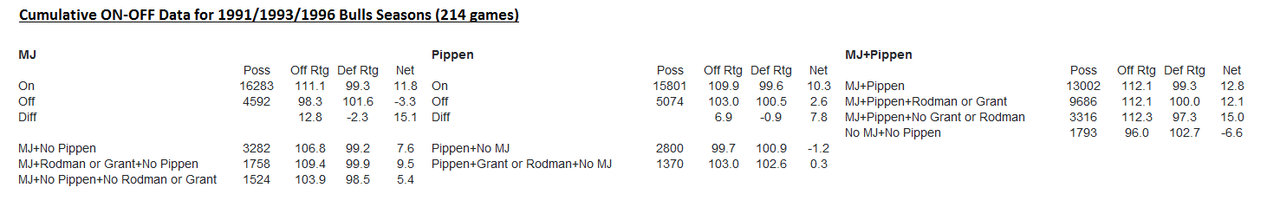
The sample we have now is 214/246 (87.0%) Bulls games in 1991, 1993 and 1996. And it's based on the full lineup data not just top 50 lineups for each season so the sample size is way larger. Thus the update.
And here are the breakdowns for each season.
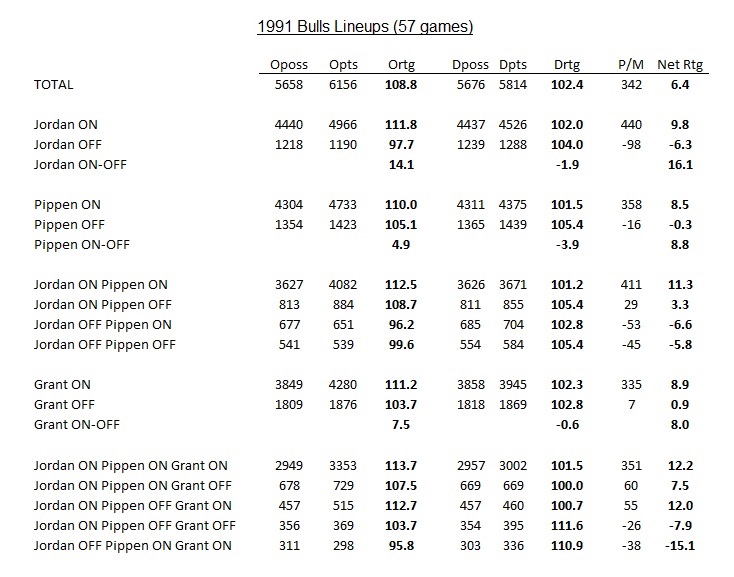
1991
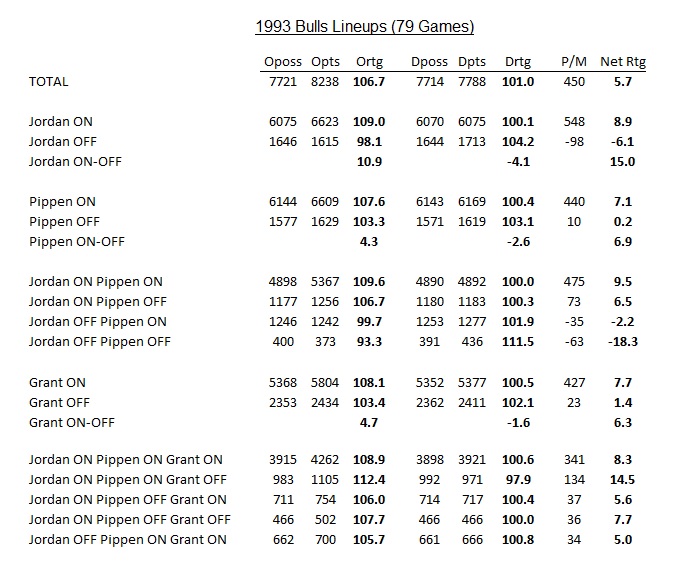
1993
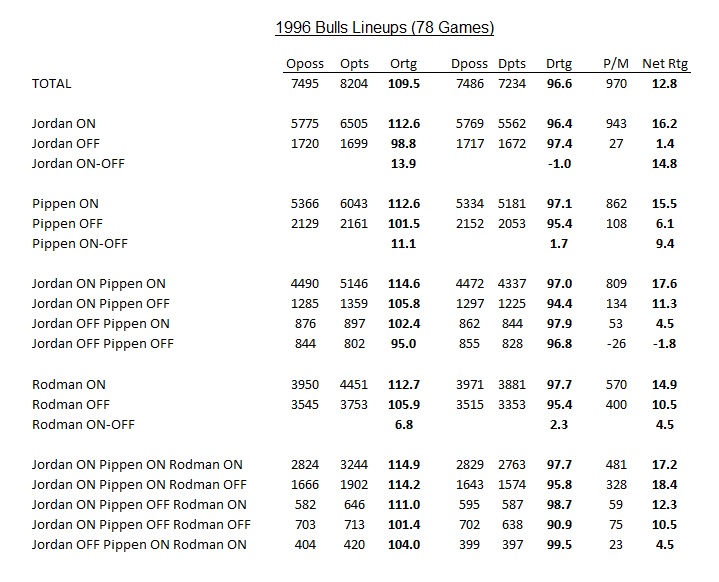
1996
ON numbers have come down slightly but are still really high. Jordan ON Pippen OFF lineups look even stronger. The presence of Grant/Rodman still doesn't seem to have a positive impact.
Once all games are eventually logged at some point, I fully expect the ON values for Jordan and Pippen to be at least a bit higher (say by +1) because the Bulls average MOV is very high in the remaining games. In 1991, there are 25 unsampled games where the Bulls went 24-1 (15.7 MOV). In 1993, there are 3 unsampled games where the Bulls went 3-0 (+21.3 MOV). In 1996, there are 4 unsampled games where the Bulls went 3-1 (+8.0 MOV). All together in the 32 unsampled games, the Bulls went 30-2 (+15.3 MOV).
Absolutely fascinating work by Squared, as always. It seems like he's tracked nearly every 1993 Bulls game since last time, which is really great stuff

Thanks Djoker for gathering it here! As an aside, how did you contact Squared to get the update? Is he available by email or something?
Just to put it into context, here's how the data for Jordan compares vs other all-time greats during their primes.
-Units: I have per48 minutes more quickly accessible than per100 possessions, and some have voiced a preference for per48 anyway. I don't have the minutes on hand for the new games sampled in 91 and 93, so I'll assume Jordan played his season-average minutes per game. He played 57 and 79 games respectively in these two seasons, which is a large enough sample that's randomly spread enough that it's reasonably fair approximation.
-Other Jordan data: I'll be using Dipper13 for 1992 (55 games), Pollack for 1995 (all games), Pollack for 1996 (all games, filling in the 4 games Squared has missed). They're all summarized in lessthanjake's thread.
Two-year RS on-off peaks:
03-04 Garnett: +22.32 (7.58 on)
16-17 Curry: +22.03 (18.31 on)
91–92 Jordan: +20.25 (11.29 on) (missing 32% of games)
94-95 Robinson: +18.28 (9.29 on)
16-17 LeBron: +16.41 (9.59 on)
00-01 Shaq: +14.47 (9.29 on)
02-03 Duncan: +13.73 (8.22 on)
94-95 Hakeem: +12.41 (6.01 on) (no full data pre-94, don't have the Squared2020 partial data on hand)
Three-year RS on-off peaks:
15-17 Curry: +21.43 (17.85 on)
02-04 Garnett: +18.0 (6.88 on)
91-93 Jordan: +17.78 (10.31 on) (missing 22% of games. +20.22 in 88/91-92)
94-96 Robinson: +17.22 (9.5 on)
15-17 LeBron: +16.25 (9.85 on)
99-01 Shaq: +13.78 (8.64 on)
01-03 Duncan: +13.71 (8.96 on)
94-96 Hakeem: +11.41 (+5.56 on) (no full data pre-94, don't have the Squared2020 partial data on hand)
Four-year RS on-off peaks:
14-17 Curry: +20.2 (15.7 on)
91-95 Jordan: +16.38 (9.99 on) (missing 17% of games. +18.08 in 88/91-93; +16.85 in 88/91-95 if 95 doesn’t enough games to be considered a full season on its own)
01-04 Garnett: +15.73 (4.63 on)
94-98 Robinson: +15.7 (9.46 on) (+17.6 in 94-97 if 97 has enough games to be considered a full season on its own)
09-12 LeBron: +15.45 (11 on)
00–03 Shaq: +12.67 (9.16 on)
02-05 Duncan: +12.28 (10.04 on)
94-97 Hakeem: +10.2 (+5.78 on) (no full data pre-94, don't have the Squared2020 partial data on hand)
Five-year RS on-off peaks:
15-19 Curry: +19.39 (16.65 on) (+20.61 in 12-16 and +20.54 16-20 if either 12 or 20 have enough games to be considered a full season on their own)
94-98 Robinson: +15.7 (8.94 on) (+? in 94-99 if 97 doesn’t have enough games to be considered a full season on its own)
91-96 Jordan: +15.69 (11.46 on) (missing 13% of games. +16.86 in 88/91-95)
03-07 Garnett: 14.55 (3.77 on)
13–17 LeBron: +14.51 (9.65 on)
00-04 Shaq: 12.64 (9.05 on)
01-05 Duncan: +12.58 (10.14 on) (no full data pre-94, don't have the Squared2020 partial data on hand)
So Jordan looks nigh-universally better than LeBron, Shaq, Duncan, late-prime Hakeem, and Robinson during these samples. He trades places with peak Garnett in on/off, but he has a significantly greater advantage in On. Really, he only looks worse than Regular Season Curry, who seems like the GOAT peak/prime in raw plus minus data.There is some uncertainty from the incomplete data for Jordan. But if anything, the available data is more likely to be underrating Jordan. The 1991 available data underrate the full-season Bulls by over 10%, which could certainly mean the data is underrating Jordan. We have no available stats for 1989 or 1990, likely peak seasons for Jordan, and we would thus naively expect his on/off to look better in these seasons than non-peak seasons like 93 or 95 or 96.
And of course, Jordan is the largest playoff improver of any of the top RS on-off players. Certainly supportive of him being a GOAT candidate / GOAT tier player.
…
Compared to the Bulls-specific players (now only considering 91/93/96 in per100 units):
-Pippen overall: Pippen looks somewhat disappointing in the available data. His 1993 season is clearly his worst year from 91-98, so I suspect it’s slightly overrepresented here, but still. Jordan has almost 2x Pippen’s on-off! Even in 1996 only, Jordan has over 50% better on-off. It's even more surprising considering how much of their minutes they shared. Most of the difference of course comes from the Bulls totally tanking the yes-Pippen-no-Jordan minutes. But it's not as if that sample is so small as to be completely noise dominated.
-Pippen’s defense: Pippen’s defense also looks worse than Jordan’s overall, which is quite surprising. Jordan’s average Defensive on-off (Rtg) is -2.3 to Pippen’s -0.9 in 91/93/96, where negative is better.
And it’s not just 93 dragging Pippen’s averages down: in 1996, with 78/82 games tracked, Jordan’s defensive on-off is -1.0 to Pippen’s +1.7.
You read that right: the 1996 Bulls seem to have played better defense with Pippen on the bench. Maybe Jordan had a worse defensive backup than Pippen, but still. That’s genuinely shocking.
Currently Pippen’s defense looks better in 1991, 1997, 1998; Jordan’s looks better in 1993, 1996. The 97-98 data definitely helps move the averages back to our prior that Pippen was likely the better overall defender. But it’s closer than I would have guessed, and to my surprise, there’s plenty of plus minus data to actually back Jordan over Pippen defensively.
-Offense vs Defense: Generally it seems like the offensive swings are much greater than the defensive swings among these players, and the same seems to be true throughout all the Squared2020 data. It’s a bit puzzling, and I’m open to suggestions. Perhaps the Bulls ran more defense-focused bench lineups? Maybe, but that wouldn’t explain the trend across the rest of the Squared2020 data. I definitely think that the ceiling for individual offensive value is higher than defensive value for the modern day, but I would have thought that they would be closer back in the 80s/90s.
-Grant looks about as expected. Not world-breaking, given he wasn’t world breaking, but clearly positive given he’s a good player and sharing the court with fantastic players. Rodman continues to look a bit disappointing in the 96 Bulls plus-minus data, although I suppose we already knew that from Pollack. Weirder still, the Bulls also look better on defense when Rodman’s on the bench!
Fun stuff