Djoker wrote:lessthanjake wrote:Djoker wrote:
1. Yes that's correct. OT periods are taken into account with the minutes played but when averaging pace by games played, it can be a small issue.
2. My method is simply average rORtg per series. Yours is average rORtg weighted by possession in those series. Small distinction but nevertheless an important one. Your method is more accurate technically speaking but I'm still unsure what is more informative. Maybe we do actually want just a simple average of all the different series. Because your possession based method gives a single 7-game series almost twice the weight of a 4-game sweep. I'm not sure that's actually a good thing. Maybe each series should be a separate but equivalent entry?
And the results we got are quite different... 1 to 1.3 points difference in rORtg is actually significant. Food for thought.
Yeah, I agree that there’s validity to a weighted-average approach and a simple average approach. I tend to think weighted-average is better if trying to assess how well a team played in the aggregate. But arguably each series matters equally, so I can see an argument for weighting each series equally.
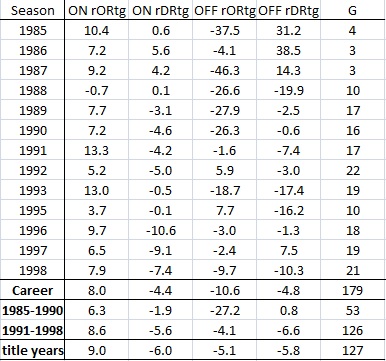
That said, I also get a different result with a simple average. For instance, if I take a simple average of Jordan’s rORTG by series, I get +9.71 for Jordan’s career, +10.39 for Jordan for 1989-1998, and +11.16 for just Jordan’s title years.
Yes taking a simple series average gives me those same averages too. 1st rounds are usually shorter than later rounds (way more sweeps and gentleman sweeps) so this tends to boost all players' numbers.
However I realize one thing generally hurting Jordan when it comes to all ON-OFF based metrics including rORtg is the 1st round being a best of 5 series. Usually the 1st round is the one round where the best teams annihilate opponents and playing 1-2 games less can really skew the result. For instance, MJ's Bulls had a +13.0 rORtg in 1993 but if the 1st round against the Hawks was 1 extra game (4-0 win instead of 3-0) and we assume the same ORtg as the other three games in the same series, the 1993 playoff average jumps up to +13.5 rORtg. Almost every playoffs except 1991, lengthening the 1st round by a game will improve the overall numbers.
From 2003 onwards, all 1st rounds are best of 7 so the likes of Nash/Lebron/Curry get an average of about one extra game against a minnow in every playoff run. It's not a huge deal but one can mentally correct Jordan's numbers up by +0.3 easily maybe even +0.5 IMO. Maybe this should be mathematically corrected for in all playoffs runs up to and including 2002.
Anyways it's interesting how the results are different depending on which method one uses to compute and average. I think I'll stick with the method in the OP because a) I've always done that and changing it would force me to recalculate a whole bunch of data for everything I've ever done!and b) Ben Taylor uses that method. I specifically asked him how his rORtg and rDRtg numbers are computed and he told me it's like that. He doesn't do a weighed average by possessions. But I'll definitely still think about it. And honestly any method is justifiable as long as it's consistently applied.
Yep, definitely on the same page about the best-of-5 thing. I actually had edited something into my prior post about that right as you posted this! In terms of weighted average vs. simple average, a player who had best-of-5 first rounds will tend to do better in a simple-average approach, for reasons I mentioned in the part I edited into my prior post.
And, on a related note, I agree that having one fewer game against a first-round minnow will tend to lower a player’s overall rORTG a bit, since good teams tend to annihilate first-round opponents. Theoretically, *relative* ratings are supposed to account for that, but in reality they don’t because those minnows don’t generally have an extra playoff gear. So, having one fewer game against an opponent that a team will tend to rack up a very high rORTG against is a disadvantage. That is an additional factor that makes Jordan’s numbers even more impressive, IMO.
More generally, I have no issue with just doing a simple-average approach. As noted, I see validity in either approach. And since we’ve both calculated numbers for other players using one of those approaches, I think it makes a lot of sense for us both to want to put Jordan’s numbers in the same format we have already used for other players.
That said, if you’re using a simple-average approach, then I think certain numbers in your OP are incorrect. The examples of this I’ve seen:
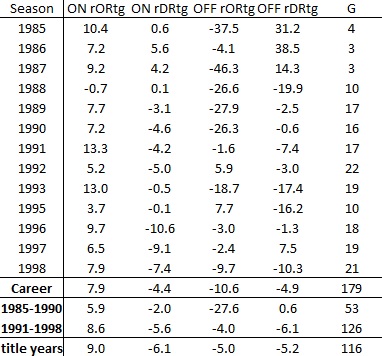
- As I read it, the OP lists a “1989-1998 Average” for Jordan’s playoff on-court rORTG as being +8.4. But using a simple average of rORTGs, Jordan’s playoff on-court rORTG in those years would be +10.39.
- It lists the “Title Years Average” as +9.0, but I think it should be +11.16.
- Jordan’s Career ON rORTG is listed as +7.9, but a simple average of his on-court rORTG in each series in his career would be +9.71.
- A simple average of Jordan’s rORTGs from 1985-1990 would be +7.33, rather than +5.9.
- It lists +8.6 for the 1991-1998 span, but the simple average would be +10.72.
Basically, I think these numbers in the OP are too low regardless of which approach we use to calculate Jordan’s on-court rORTG.