There was discussion in the mid and late 2000s about the tradeoff between scoring via offensive rebounding vs. what you give up on defense presumable as you’d not be able to get back as effectively if actively attempting to offensive rebound. I believe Popovich discussed this.
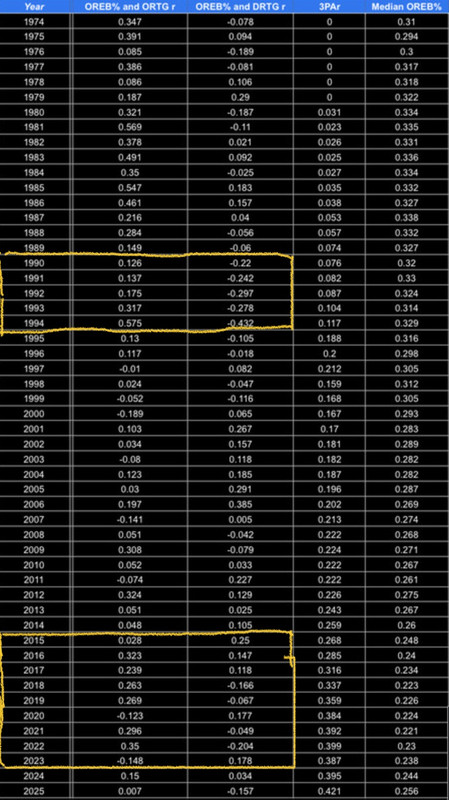
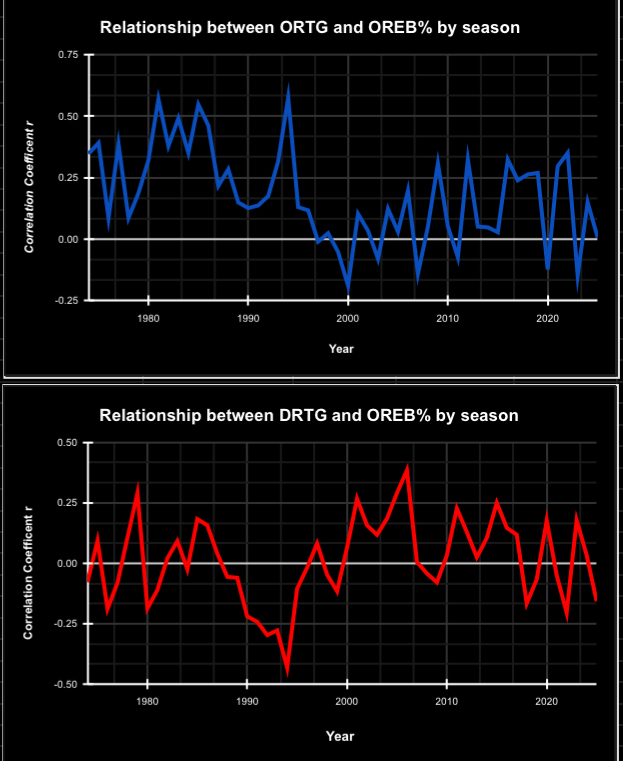
I found the correlation coefficient between OREB% and ORTG for every season between 1974 and 2025. The closer to 1.0 you get means that for that particular season, higher offensive rebounding% correlated more strongly with higher ORTg.
I also found the correlation coefficient between OREB% and DRTG for every season between 1974 and 2025. The closer you get to 1.0 means that higher offensive rebounding % correlated with a HIGHER DRTG (i.e., higher offensive rebounding% correlated with a worse defense) and the closer you get to -1.0, means that higher offensive rebounding% correlated with a LOWER DRTG (i.e., higher offensive rebounding% correlated with a better defense).
Most of the r values are modest and correlation doesn’t mean causation, but it’s interesting to see the trends in the NBA through the various eras.
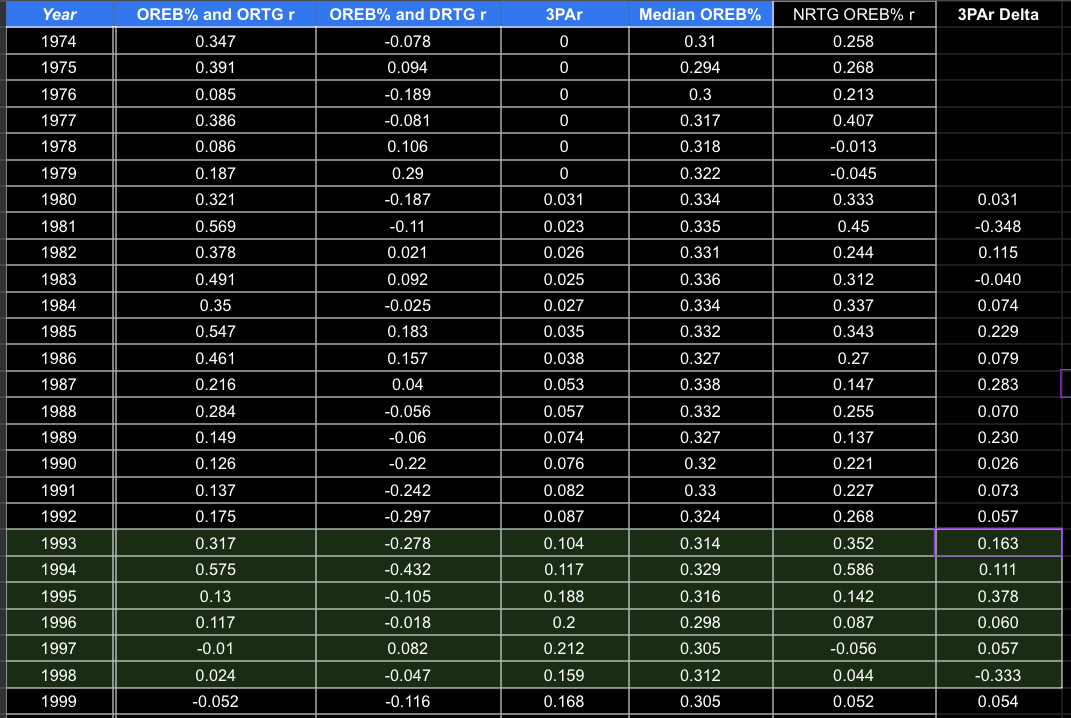
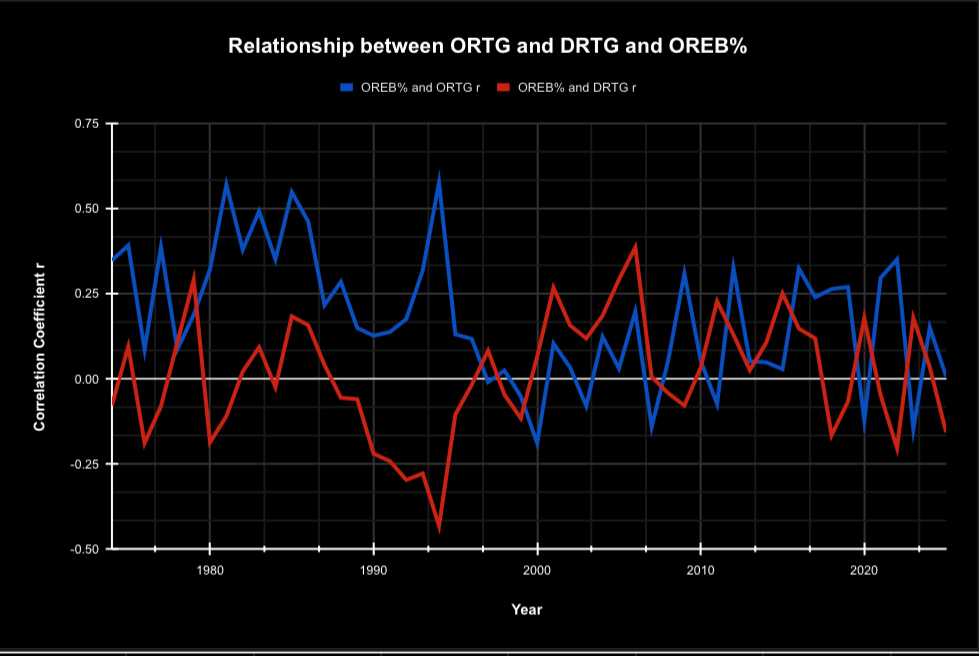
You can also see them both at the same time. You can see in most seasons, higher offensive rebounding % correlated with higher ORTG as one would think but there are seasons when it also correlated with higher DRTG. When the the blue line is inside red line, higher offensive rebounding % correlated more strongly with higher defensive ratings than it did with higher offensive ratings. When you have a big gap, it means that higher offensive rebounding correlated with higher ORTGs and lower DRTGs. Before the 3pt era and from the late 1980s to the latter part of the 1990s, offensive rebounding correlated with higher ORTGs and lower DRTGs. This was also the era when higher ORTGs correlated the strongest with LOWER DRTGs.
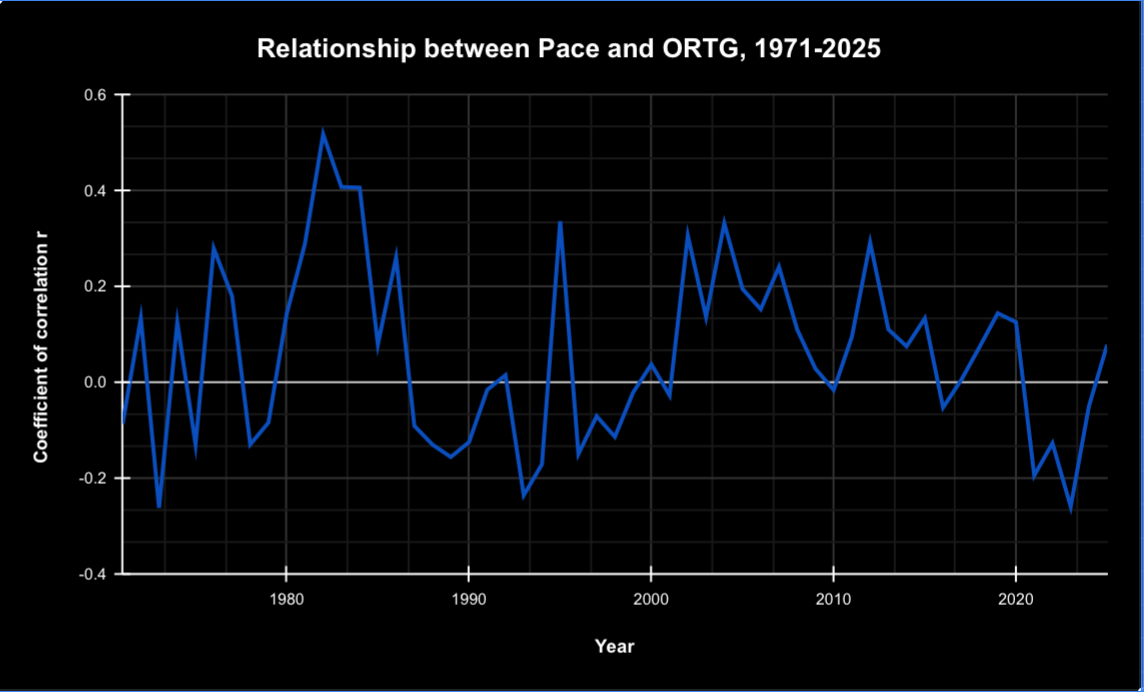
It’s also interesting to see the relationship through the years of the correlation between ORTG and DRTG, i.e., what if any relationship does higher ORTGs have on defense when looking at the league as a while.

You can see all the seasons here
Spoiler: