I'll use the list of players with at least one vote to start my analysis. I'll assume their is not another top-10 peak outside of those players to reduce the body of work. I'll also assume that each player would play the same in this era.
With those two assumptions, I'll go to the advanced analytic methods. Now most would use their favorite version of "reward everything good, punish everything bad" analysis (ie, PER) which would serve as a complete evaluation of these players. It would be easy to line them up by PER, put a ranking to it and just call it good.
The problem with these types of analysis is that the formulas never come from empirical analysis, but are instead derived arbitrarily. This means that instead of working from the data and trying to find out what correlates to creating wins, the people that make these stats simply estimate weights and create formulas to create something that "looks right." They are usually a little better at prediction than PPG, but not much.
Now usually I would say that MPG should be ignored and we should use possession-less stats to get a more accurate picture of each player's production. But for a peak season, minutes ARE important. A player that plays 40 MPG gives more production than the same player playing 20. Every form of analysis has flaws, and while per minute or per possession stats are valuable in many situations I think they start to falter when you are comparing peaks. In this case each player was a star, which eliminates the primary advantage of per-whatever measurements, the ability to compare starters and stars with bench players.
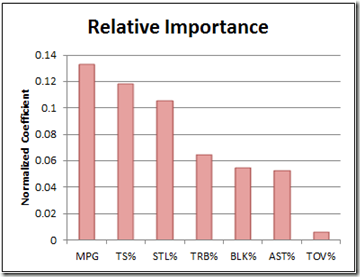
So first I'll try and derive some way to tell empirically which statistics tend to be the most important. Or to be frank, I'll let others pave the way for me. Ben Morris (from Skeptical Sports Analysis) has already done much of this work, and most of my reasoning originates from his series on Dennis Rodman (fascinating stuff, I recommend it to anyone who cares about sports analysis). To cut this short, he calculated the relative importance of each stat with a linear regression, the result of which is below:
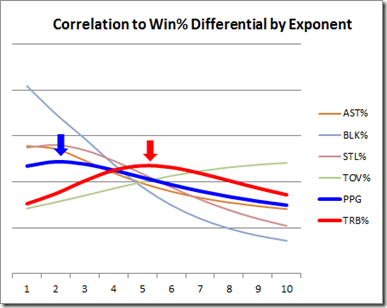
Now is as good of time to mention a third assumption that I've made by omission. I've assumed that each of these scales linearly. IE, the difference between getting 1 rebound and 2 is the same as the difference between getting 4 and 5. But that isn't always the case. For some stats, extreme values are much more predictive of winning a game. The biggest example is TOs. Losing the ball once is negligible, and simply multiplying that by 10 still seems like a fairly small impact. But losing the ball 10 times has a much larger impact than that.
Below is a chart to address that as well. The graph is hard to understand, so I'll explain it. The numbers on the bottom correspond to the exponent of regression. What we are looking for are the peaks for each stat. These peaks show where the stat is most predictive. If they peak close to 1, they are nearly linear. If it peaks at a higher exponent, then it diverges from linearity and extreme values are more predictive than smaller values.
Anyway, I tried to throw the numbers into some sort of equation. It isn't perfect, but it gave the following:
If we treat high rebounding values well (ie, give priority to extreme cases):
#1: Shaq 99'-00'
#2: Bird 84'-85'
#3: Jordan 88'-89'
#4: James 09'-10'
#5: Durant 09'-10'
Problem is that this didn't give enough to get a ranking for Russell, Chamberlain, Olajuwon, Johnson, Duncan, Oscar Robertson, Erving or Kareem. However, treating things more linearly for rebounding (none of them have high enough TO% to hurt themselves) gives:
#1: Jordan 87'-88'
#2: Shaq '99-00'
#3: Bird 87'-88'
#4: James 07'-08'
#5: Bryant 05'-06'
This is still far from a complete analysis. I'll probably redo it with the normally selected peak years of each player to try and get a ranking closer to normal. From what I've seen though, the rankings almost have to have Jordan and Shaq in the top 2, and Bird probably should be higher than most have him. And James has already put up seasons that are good enough to rank with the best all-time.
For ranking purposes, use the second group of five.