

Fun with Stats!!!
Moderators: BigSlam, yosemiteben, fatlever, JDR720, Diop
Re: Fun with Stats!!!
-
LamarMatic7

- Hornets Forum High-End Journalist
- Posts: 9,792
- And1: 2,381
- Joined: Jan 02, 2011
- Location: Latvia
- Contact:
-


Re: Fun with Stats!!!
Starters are almost at +20 after 38 minutes played. Have played very well against opposing starting units.

Re: Fun with Stats!!!
-
steady

- Veteran
- Posts: 2,638
- And1: 1,351
- Joined: Jul 13, 2015
-

Re: Fun with Stats!!!
fatlever wrote:Quick thoughts:
- Zeller at PF is absolutely sinking lineups right now. His only good minutes have come at C.
- Conversely, Marvin at PF is fantastic.
- However, Marvin at SF is not good, probably has more to do with playing next to Zeller at PF and sometimes Hawes at C, more than anything else.
- Lin and Batum together is producing some good offense.
Great stuff
Nice to have confirmation of some things I thought I was seeing
Re: Fun with Stats!!!
-
Braggins
- RealGM
- Posts: 14,652
- And1: 9,385
- Joined: Jan 05, 2014
Re: Fun with Stats!!!
I would love to see what a lineup of Kemba, Lin, Lamb, Batum, Cody, could do. If you count Marv as primarily a PF then I can't really hardly ever remember us playing without a traditional PF/C combination on the floor while Clifford has been here. There are plenty of opportunities to go small like this and other teams constantly exploit us for not being willing to do it.
Re: Fun with Stats!!!
-
TTNN
- Junior
- Posts: 325
- And1: 168
- Joined: Aug 16, 2015
-

Re: Fun with Stats!!!
EwingSweatsALot wrote:Is there a way to get single game player tracking stats on NBA.com. Or is it just season?
yes, you should be able to do it.
If you click the little gear icon on the right hand side, you will have all kinds of filter. You could select the last game, or you could filter with the month, then the vs team, if the team play against that team twice within the same month, you could also select home game or away game or game result to get to the specific game data.
I also found the "add a custom filter", then input CHA for the team is really useful if you want to focus on only our team players.
Re: Fun with Stats!!!
-
yosemiteben

- Forum Mod - Hornets

- Posts: 22,493
- And1: 15,697
- Joined: Mar 20, 2013
-


Re: Fun with Stats!!!
Through three games, we are ranked 21st in offensive efficiency and 21st in defensive efficiency. Lots of room for major improvement in both.
Re: Fun with Stats!!!
-
yosemiteben
- Forum Mod - Hornets
- Posts: 22,493
- And1: 15,697
- Joined: Mar 20, 2013
-
Re: Fun with Stats!!!
Through four games, we have posted by far the best DRB% at an absurd rate of 86.6%. Last season we were the best defensive rebounding team in the league at just 79.3%. The second best team, Indy, posted a rate of 77.9%. The season before we were also the best defensive rebounding team in the league at just 77.6%. We are rebounding at an extremely impressive rate right now.
Interestingly we are also posting a league average ORB% of 23.8%. We were second to last in the league in ORB% last season at 22.1%, and 5th worst the season before at 21.9%. ORB% seems to be really down across the league, so we'll likely drop in our relative ranking even if we hang on to that percentage. Our current ORB% would have ranked 22nd in the league last season.
Our defense has slightly fallen off, but not significantly - we have a 102.1 DRTG this season. Last season our DRTG was 101.0, which was 9th overall. The season before our DRTG was 101.2, which was 6th overall. Our relative ranking based on DRTG is really low right now, but across the board the DRTG stats are much lower than is typical and they'll surely adjust as the season goes on to more typical historical levels. Our current 102.1 DRTG would have put us right at league average last season.
Re: Fun with Stats!!!
-
EwingSweatsALot

- Veteran
- Posts: 2,783
- And1: 919
- Joined: Jul 12, 2013
-


Re: Fun with Stats!!!
I took a quick 10 minute look at ORTG and DRTG based on the opponents of each team. With teams only being 3-5 games into the season the ORTG and DRTG can be misleading depending on who you play. If you played the four worst defensive teams and have a 100 ORTG it's not as good as if you had a 100 ORTG playing the four best defensive teams.
I basically took each teams ORTG and DRTG and compared it to the average of those stats for the opponents they have played. Not the most scientific way to do it, but a quick and somewhat efficient way.
NOTE***** this like other stats can be skewed because of one game or playing the same opponent multiple times.
So we are a +7.5 on ORTG. So our ORTG is 7.5 points higher than our opponents DRTG. This actually has us as 2nd best in the league. A lot of this probably has to do with last nights game though.
Our DRTG is a +2.0. Meaning we allow 2 more points per 100 than our opponents score. 22nd in the league viewing it this way.
The net brings us to +5.5 points. 8th in the league.
Skewed in some ways yes. Does it tell us anything? Maybe not. We are 1-3 but 8th in this stat, huh? But the two teams we have lost two are 7th and 9th in this stat and we showed we are somewhat capable of playing with them.
BTW the funniest part of this stat is Brooklyns Net is -19.7. The next worst is the Lakers at -11.3. Holy hell they are awful.
EDIT: I would much rather use ORTG and DRTG that doesn't include the game that the team plays against. So for instance when using CHI stats I'd rather not include our game against them in those stats because hiw we played them affects those stats. In a way it's comparing us to us. It's why GSW isn't number one in ORTG because they have caused their Opp average to sky rocket. But it's way too much work to delve into that part. Over time and adding to this, the percentages each game affects will lessen.
Re: Fun with Stats!!!
-
Roy Tarpley
- Veteran
- Posts: 2,888
- And1: 987
- Joined: Jul 06, 2015
-


Re: Fun with Stats!!!
fatlever wrote:Worst lineup probably - Anything with Marvin, Zeller, Hawes at the same time (especially Zeller/Hawes)
This lineup is the primary bench lineup that the Hornets play in the 2nd quarter -- typically with Lin. To counteract this Zeller-Hawes effect, you need to have a secondary ballhandler in the lineup, whether it's Lin-Batum or Lin-Kemba.
Re: Fun with Stats!!!
-
yosemiteben
- Forum Mod - Hornets
- Posts: 22,493
- And1: 15,697
- Joined: Mar 20, 2013
-
Re: Fun with Stats!!!
Was curious about our usage rates so far so I looked them up. No one on the Hornets roster is in the top 50 in usage rates. Here are our rankings:
Lin - tied at 53rd, 24.2%
Walker - tied at 55th, 24.1%
Lamb - 60th, 23.7%
Al - 67th, 23.0%
Batum - tied at 74th, 22.7%
Further evidence of our improved ball movement.
Lin - tied at 53rd, 24.2%
Walker - tied at 55th, 24.1%
Lamb - 60th, 23.7%
Al - 67th, 23.0%
Batum - tied at 74th, 22.7%
Further evidence of our improved ball movement.
Re: Fun with Stats!!!
-
yosemiteben
- Forum Mod - Hornets
- Posts: 22,493
- And1: 15,697
- Joined: Mar 20, 2013
-
Re: Fun with Stats!!!
Was playing around with the nba.com stats page. We have taken the most catch and shoot FGAs in the league at 31.5, while being tied for second highest eFG% on those shots at 54.4%. We have also taken the most catch and shoot 3PTAs by a decent margin (23 per game, 3 more than the second highest team), and we have the third highest 3PT% on those shots at 40.2%.
We are ranked 20th in number of pullup threes, but we actually have a higher % on those (42.9%) than we do on catch and shoot threes.
Somewhat unsurprisingly, we are bottom 5 in FGAs within 10 feet and bottom 5 in FG% on those shots. Finishing inside has definitely been a struggle for us so far, but fortunately our offense is much less dependent on those shots.
Re: Fun with Stats!!!
-
Roy Tarpley
- Veteran
- Posts: 2,888
- And1: 987
- Joined: Jul 06, 2015
-
Re: Fun with Stats!!!
I wonder if they track the numbers of dunks, I bet we're last in that category. Also, there is no lower percentage shot than one by Hawes in the post -- I don't think he even looks at the basket as he throws a shot over his shoulder in the general vicinity of the rim.
Re: Fun with Stats!!!
-
EwingSweatsALot
- Veteran
- Posts: 2,783
- And1: 919
- Joined: Jul 12, 2013
-
Re: Fun with Stats!!!
Does anybody use popcorn machine to look at lineups and how we use them? Saw Zach Lowe tweet about them a day or so ago. Really need info.
Breaks down the lineups we use and how often. And even breaks down each players stint in the games.
Below is a link to the Dallas game from last night.
http://popcornmachine.net/gf?date=20151105&game=CHADAL
Breaks down the lineups we use and how often. And even breaks down each players stint in the games.
Below is a link to the Dallas game from last night.
http://popcornmachine.net/gf?date=20151105&game=CHADAL
Re: Fun with Stats!!!
-
sidestep
- Pro Prospect
- Posts: 792
- And1: 152
- Joined: Sep 02, 2012
-

Re: Fun with Stats!!!
@EwingSweatsALot
That's cool stuff. I think the most useful part of the 'GameFlow' chart is it lets you correlate lineups with the game's key runs and momentum changes.
For example, in the left highlighted area, when the Mavs started the 16-4 run, that happened shortly after Roberts entered the game. (Roberts was subbed in for Cody. Cliff went small to match the Mavs going small: they took out their center, Pachulia, and moved Dirk to the 5 spot.)
In the middle highlighted area, the 13-2 run by the Hornets in the 3rd quarter opened the lead. It had this lineup: Batum, Marvin, Kemba, Al, PJ.
The 15-2 run at the beginning of the 4th quarter that extended the lead into a blowout had this lineup: Hawes, Lamb, Lin, Cody, Marvin.
Re: Fun with Stats!!!
-
steady
- Veteran
- Posts: 2,638
- And1: 1,351
- Joined: Jul 13, 2015
-
Re: Fun with Stats!!!
This is very very cool stuff!
What does hv stand for ? In the totals column on the right side
What does hv stand for ? In the totals column on the right side
Re: Fun with Stats!!!
-
sidestep
- Pro Prospect
- Posts: 792
- And1: 152
- Joined: Sep 02, 2012
-
Re: Fun with Stats!!!
steady wrote:This is very very cool stuff!
What does hv stand for ? In the totals column on the right side
Each bar shows exactly two numbers. The first is the player's points during that stretch. The second number is his 'Help Value', which is the total number of Rebounds, Assists, Blocks and Steals, minus his Turnovers.
It's just a way to compress player stats into two numbers, so that the readings for each bar are not overly busy and convoluted.
Re: Fun with Stats!!!
-
steady
- Veteran
- Posts: 2,638
- And1: 1,351
- Joined: Jul 13, 2015
-
Re: Fun with Stats!!!
sidestep wrote:steady wrote:This is very very cool stuff!
What does hv stand for ? In the totals column on the right side
Each bar shows exactly two numbers. The first is the player's points during that stretch. The second number is his 'Help Value', which is the total number of Rebounds, Assists, Blocks and Steals, minus his Turnovers.
It's just a way to compress player stats into two numbers, so that the readings for each bar are not overly busy and convoluted.
Great thanks
The chart is such a good tool for seeing flow of game and which units were most effective , and against whom.
Re: Fun with Stats!!!
-
yosemiteben
- Forum Mod - Hornets
- Posts: 22,493
- And1: 15,697
- Joined: Mar 20, 2013
-
Re: Fun with Stats!!!
Awesome find ESAL. I was seriously considering starting to post substitution logs after each game so we could analyze our rotations, but this is so much better and more valuable than that.
Re: Fun with Stats!!!
-
spaceballer
- Head Coach
- Posts: 6,581
- And1: 2,707
- Joined: Mar 05, 2012
Re: Fun with Stats!!!
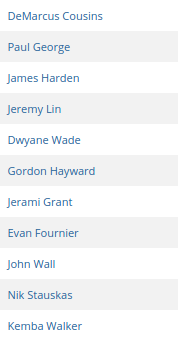
Jeremy Lin at #4, behind Cousins, Paul George, Harden. Kemba just fails to make top 10, but he's at the #11 spot.
Hive Talk Live
@HiveTalkLive
Lin and Kemba both in the top 11 in PF-drawn % on drives among guys who drive >5 times a game.
https://twitter.com/HiveTalkLive/status/662805597646151680/
Re: Fun with Stats!!!
-
EwingSweatsALot
- Veteran
- Posts: 2,783
- And1: 919
- Joined: Jul 12, 2013
-
Re: Fun with Stats!!!
sidestep wrote:@EwingSweatsALot
That's cool stuff. I think the most useful part of the 'GameFlow' chart is it lets you correlate lineups with the game's key runs and momentum changes.
For example, in the left highlighted area, when the Mavs started the 16-4 run, that happened shortly after Roberts entered the game. (Roberts was subbed in for Cody. Cliff went small to match the Mavs going small: they took out their center, Pachulia, and moved Dirk to the 5 spot.)
In the middle highlighted area, the 13-2 run by the Hornets in the 3rd quarter opened the lead. It had this lineup: Batum, Marvin, Kemba, Al, PJ.
The 15-2 run at the beginning of the 4th quarter that extended the lead into a blowout had this lineup: Hawes, Lamb, Lin, Cody, Marvin.
Hell of a way to use this tool.
they are on twitter @pmgameflows for anyone wanting to follow them. They send out a link for each game they put out.
Re: Fun with Stats!!!
-
EwingSweatsALot
- Veteran
- Posts: 2,783
- And1: 919
- Joined: Jul 12, 2013
-
Re: Fun with Stats!!!
So I built a spreadsheet that will now basically take me 5 minutes to update each day of the stat I discussed in my rambling post above.
Basically I wanted to compare each teams ORTG and DRTG compared to who their opponent's have been. Basically normalizing each team with their opponent's average. The pic below is the result of what I have come up with right now.
Team, Games Played, Team W%, Net Diff, ORTG Diff, DRTG Diff
Sorted by Net Diff.
Red is hot, Blue is cold.
We will see if this leads to anything, it might be nothing. But for 5 minutes a day it could be worth it.