McHale v. Mutombo -- clearly McHale has a terrific offensive edge in terms of scoring, Mutombo has a strong edge in terms of rebounding and defense accolades.
McHale 12 years 31.0mpg
11.4reb 2.7ast 3.0to 27.8pts per 100 possessions @ .605ts%
10.9 2.4 2.8 27.6 @ .618 for playoffs
3x1st All-Defense, 2x 2nd All-Defense
Mutombo 16 years (+2 partials) 30.8mpg
17.6reb 1.8ast 3.1to 16.7pts per 100 possessions @ .573ts%
17.2 1.4 2.7 16.4 @ .587 for playoffs
4x DPOY 4x1st All-Defense 3x2nd All-Defense
. . . .
Reed v Cowens v. Beaty
All three shared some things in common . . . undersized, mobile centers with good range and good defense. Reed is the strongest, Cowens the most physical, Beaty has a Bill Laimbeer/Vlade Divac rep for annoying opps with a lot of dirty/veteran tricks.
All had shortened careers, Reed played only 7 years over 20 games in a season, Cowens played 10 but with increasing missed games plus a half year attempted comeback in Milwaukee, Beaty played 12 seasons (2 as reserve) but 2 were cut short by his recurring knee injuries; it's not a coincidence that his best season (72 in Utah) came after being forced to sit out a year. Beaty is considered a step down from Reed and Cowens but seems a reasonable comp to show their strengths.
Prime numbers
Reed (67-71) 20.5ppg 13.5reb 2ast .540ts%
Cowens (72-76) 19.5ppg 15.5reb 4ast .495ts%
Beaty* (65-69) 20ppg 12reb 1.5ast .535ts%
*(using NBA numbers only)
As the numbers show, Cowens was the best passer and rebounder, but the worst shooter. Reed is slightly better than Beaty in all areas but only slightly (and the NBA had expansion in these years so Reed was playing against slightly inferior competition). Beaty has the longevity edge. Very comparable players if you consider their defensive abilities roughly equal. I didn't use Beaty's ABA years because I don't want to get into a debate about how much to discount them.
Right now I think the best wing left is Alex English, a bit above Dantley, Carter, or Richmond. I am open to arguments for Sam Jones or Paul Arizin but the comps we had 2 threads ago had them looking like a bit below Dolph Schayes who I don't have up with the best bigs left, though I am open to being convinced.
There are also a lot of short career prospects. The shortest and greatest peak would be Walton; others would include Connie Hawkins, Tracy McGrady, or Sidney Moncrief..
RealGM Top 100 List #44
Moderators: PaulieWal, Doctor MJ, Clyde Frazier, penbeast0, trex_8063
RealGM Top 100 List #44
-
penbeast0
- Senior Mod - NBA Player Comparisons

- Posts: 28,447
- And1: 8,679
- Joined: Aug 14, 2004
- Location: South Florida
-


RealGM Top 100 List #44
“Most people use statistics like a drunk man uses a lamppost; more for support than illumination,” Andrew Lang.
Re: RealGM Top 100 List #44
-
trex_8063
- Forum Mod

- Posts: 11,853
- And1: 7,269
- Joined: Feb 24, 2013
-


Re: RealGM Top 100 List #44
Dolph Schayes (‘50-’61)---12-year span, 850 rs games
Estimate Per 100 possessions (rs): 23.8 pts, 15.7 reb, 3.8 ast @ 49.1% TS% (+4.4 to league avg)
*PER 22.9, .206 WS/48 in 36.9 mpg (for '52-'61).
Was even better in playoffs.....
Estimated Per 100 possessions (playoffs): 25.1 pts, 16.0 reb, 3.5 ast @ .507 TS%
*24.0 PER, .201 WS/48 in 36.0 mpg (for '52-'61).
Career rs WS: 142.4 (#26 all-time)
Career playoff WS: 14.0 (#44 all-time)
#44 all-time in MVP Award Shares (and MVP was not something that was even awarded during his first SIX seasons). He was in the top 5 in MVP voting three times, six times in the top 8. In ‘58 he finished 2nd only to Bill Russell (even ahead of Bob Pettit!).
In the RealGM RPoY project, he was rated the 3rd-best player in both ‘57 and ‘58 (behind only Russell and Pettit), was rated THE BEST player in the game in ‘55. Is at least top 6 two other seasons. Overall he’s #24 in RealGM RPoY Shares.
12-time All-NBA team (6 1st Teams, 6 2nd Teams).
Era considerations apply, but if I can piggy-back on Owly's internal consistency comments: this forum did vote George Mikan (whose career is even earlier, marginally, and whose career was barely half the length of Schayes's) in at #24. And while Schayes was not as dominant as Mikan, the above shows that he was indeed elite for many years: basically TWICE as long as Mikan, and did so through about half of the Bill Russell era. He only stopped being one of the league's elite when he was getting somewhat far north of age 30 (about 33 to be precise). fyi, some other players (already voted in) who were pretty diminished (if not out-right "fell off a cliff") by age 33 or sooner include: Walt Frazier, Bob Pettit (retired before hitting 33), George Mikan, Elgin Baylor, Isiah Thomas (retired at age 33), and I suspect Dwyane Wade. Realistically, I'm not sure we can hold fading effectiveness at age 33 against him.
And he did actually have two more fair-to-decent role player years after that. His only completely ineffectual year was his final season (was 35 going into it).
During his peak years, it could even be said that he was one of a few players who "dominated" the game (albeit to a smaller degree than Mikan).
During his best 5-year span ('54-'58), which is mostly in the shot-clock era....
Dolph Schayes (‘54-’58)
Estimate Per 100 possessions (rs): 24.7 pts, 15.5 reb, 3.6 ast @ .499 TS% (avg +4.8% to league)
PER 24.0, .231 WS/48 in 37.4 mpg
Again, looks even marginally better in post-season....
Estimated Per 100 possessions (playoffs): 25.0 pts, 16.8 reb, 3.6 ast @ .501 TS%
PER 25.6, .229 WS/48 in 34.8 mpg.
Regarding speculation on era-translation, I'd like to again just throw out that reminder that it is indeed just speculation.
Further, I think there's something to be said for the best of the best in your own time, and helping to carry forth the evolution and grow the popularity of the game. Leonardo di Vinci's understanding of physics and engineering would be considered pretty infantile relative to modern inventors and engineers. Doesn't change the fact that he was a genius. I tend to feel somewhat similarly about basketball's history.
"If I have seen a little further it is by standing on the shoulders of Giants."
--Isaac Newton
I can't find it in myself to disregard the achievements of past greats (especially when they were AS ELITE as the above indicates) based on statements like "meh, not athletic enough to dominate in the modern game" or similar.
Vote: Dolph Schayes
"Never argue with an idiot. They will only bring you down to their level and beat you with experience." -George Carlin
"The fact that a proposition is absurd has never hindered those who wish to believe it." -Edward Rutherfurd
"The fact that a proposition is absurd has never hindered those who wish to believe it." -Edward Rutherfurd
Re: RealGM Top 100 List #44
-
tsherkin
- Retired Mod

- Posts: 78,780
- And1: 20,211
- Joined: Oct 14, 2003
-

Re: RealGM Top 100 List #44
Hmmmm...
Can't really say I think Schayes belongs here, so I won't be voting for him.
Willis Reed should be gaining traction now, and was clearly better than Schayes, IMO. Probably better than Cowens, too, who was surprisingly bad as a scoring threat. All those jumpers really didn't do him any favors, I suppose. We're soon approaching Nique's space, too. English, Dantley. Moncrief had 7 years before he fell apart, 5 of them really noteworthy; don't think longevity lets him be part of this section, despite his obvious talent and skill. Might be thinking about KJ, but he's only marginally better than Moncrief ITO longevity (his last 5 seasons were 70 games and under, 5 of his last 7 were 56 or less, etc, etc. Grant Hill comes to mind, as does McGrady. Vince comes to mind. Tim Hardaway, Mitch Richmond. Tony Parker. Penny isn't there yet, but his name should be coming up soon-ish. AI isn't far away. Bernard King.
Chris Mullin has a WIIIICKED 6-year prime (25.0, 5.3, 4.2, 59.9% TS, 117 ORTG), so he's definitely worth thinking about.
Circling back to Vince Carter, we're talking about a guy entering his 17th season, which is typically a shocker for players initially known for athletic prowess. Career 20.2, 4.9, 3.7 player (53.8% TS, 109 ORTG).
Toronto peak was 00-02 (217/246 GP), 26.1 ppg (peaked at 27.6), 5.6 rpg, 3.9 apg, 53.8% TS (brought down by his injured 02 campaign), 111 ORTG.
New Jersey peak was 06-09, but of course his half season in 05 was remarkable as well.
05: 57 GP, 27.5 ppg, 5.9 rpg, 4.7 apg, 55.6% TS, 110 ORTG
06-09: 22.9 ppg, 5.7 apg, 4.7 apg, 54.7% TS, 110 ORTG
So as you can see, not a properly stunning offensive player, but he had some moments and played at a Melo-ish level, with superior playmaking and passing compared to Anthony (and general perception of Carter as a player). He's been in the league a long time, and reinvented himself as a roleplayer for first the 2010 Magic, then the Suns, and for the past 3 seasons he's been contributing nicely to the Mavericks. He's signed with the Grizzlies now, so we'll see what he's got. Has really developed his 3pt shot as a roleplayer. Had it earlier in his career, for sure, but he's doing very well with the Mavs, so Memphis has that to look forward to when he finally arrives.
===
I think this slot is probably going to a SF for me. I like Reed, but I think I may actually have to vote: Vince Carter here.
EDIT:
Post wouldn't be complete without some English numbers. Pace is a factor, BUUUUTTT....
He played 80-82 games in all seasons of his 81-89 prime.
26.9 ppg, 5.7 rpg, 4.6 apg, 55.7% TS, 113 ORTG
Food for thought. Still voting Vince.
Re: RealGM Top 100 List #44
-
john248

- Starter
- Posts: 2,367
- And1: 651
- Joined: Jul 06, 2010
-

Re: RealGM Top 100 List #44
Leaning Ray Allen, McHale, and maybe McGrady about now. Pau, Nique, and Reed deserve a mention too.
The Last Word
Re: RealGM Top 100 List #44
-
Quotatious

- Retired Mod
- Posts: 16,999
- And1: 11,142
- Joined: Nov 15, 2013
Re: RealGM Top 100 List #44
Alex English (gets overlooked, as always...if tsherkin mentioned guys like Richmond or Mullin, I don't see why English doesn't deserve to be mentioned) and Elvin Hayes are my top candidates here. Will elaborate later on. Also considering Iverson and McGrady, but a bit lower than English/Hayes.
EDIT - oh, well, tsherkin edited his post and added English. I'm glad he did.
EDIT - oh, well, tsherkin edited his post and added English. I'm glad he did.
Re: RealGM Top 100 List #44
-
Moonbeam
- Forum Mod - Blazers

- Posts: 10,135
- And1: 4,939
- Joined: Feb 21, 2009
- Location: Sydney, Australia
-


Re: RealGM Top 100 List #44
Sorry I missed the last vote! I'm leaning Schayes, but also hope to take a close look at Reed, Cowens, Jones, McHale, Dantley, English, and Wilkins.
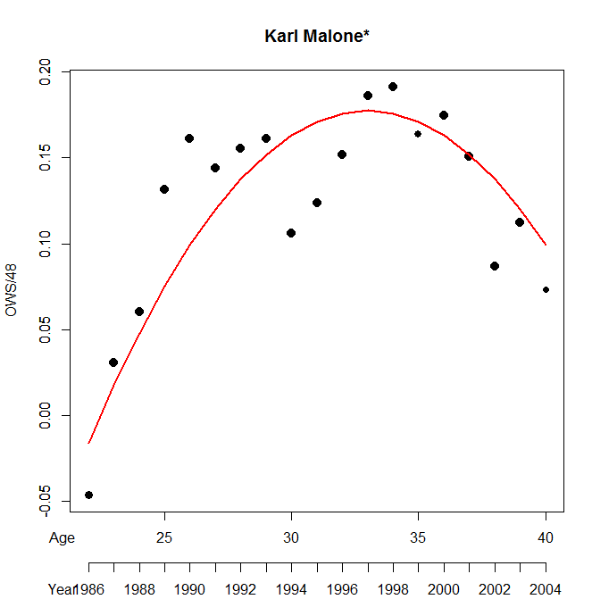
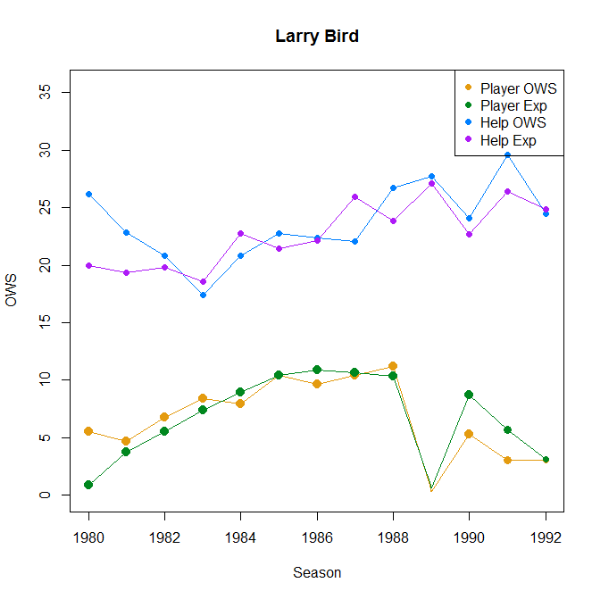
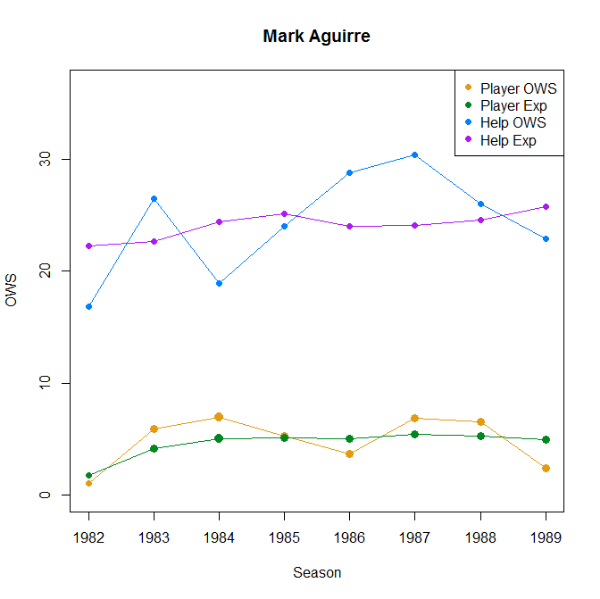
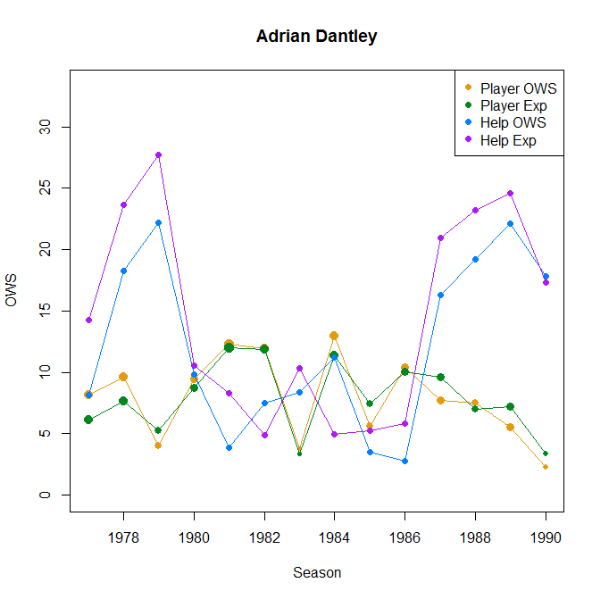
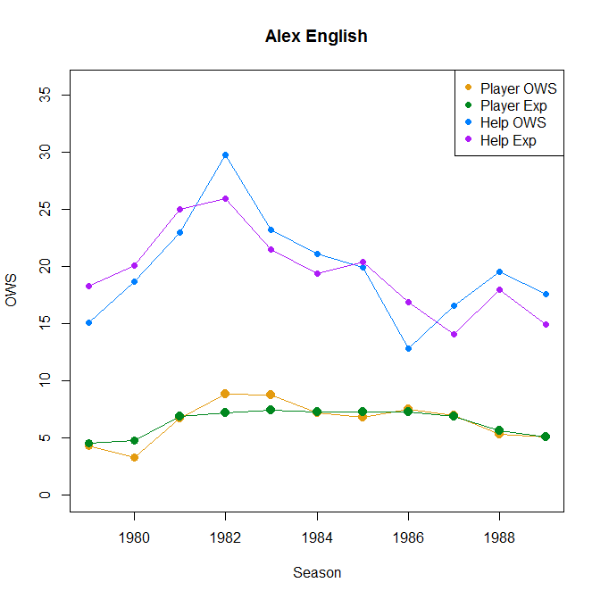
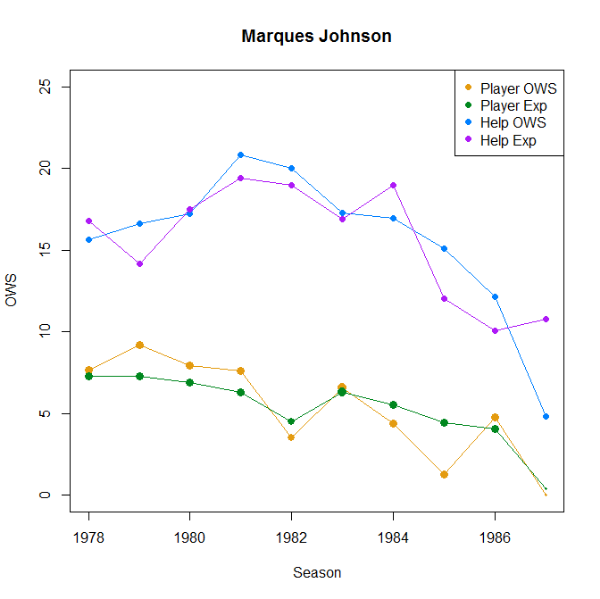
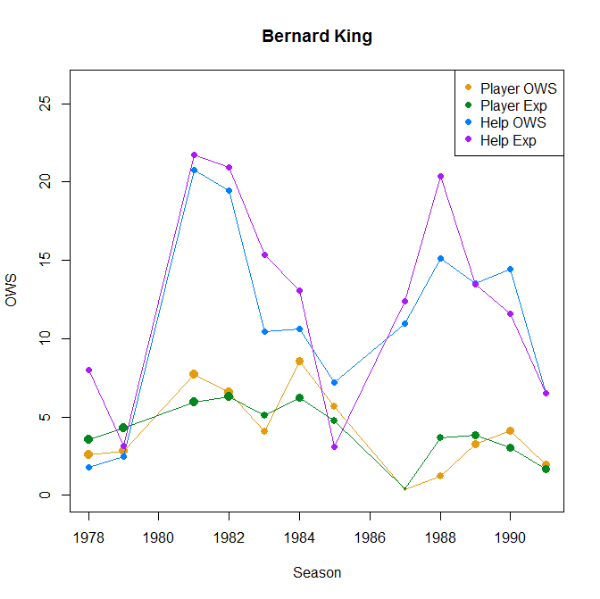
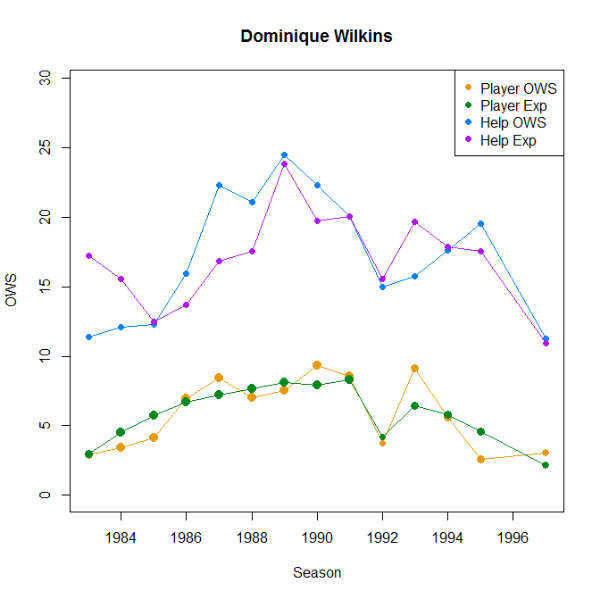
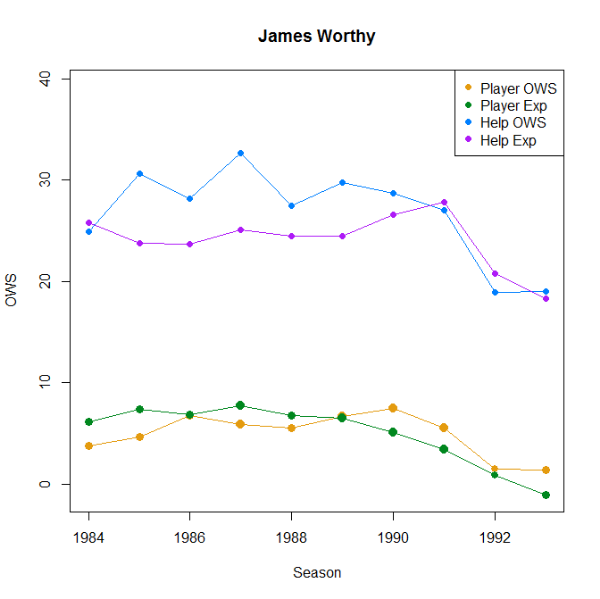
For those interested in a comparison of 80s SFs, I did a bit of analysis in this thread.
Attempting to decompose OWS:
Head to head against top-flight SFs of the 80s:
For those interested in a comparison of 80s SFs, I did a bit of analysis in this thread.
Attempting to decompose OWS:
Spoiler:
Head to head against top-flight SFs of the 80s:
Spoiler:
Re: RealGM Top 100 List #44
-
ThunderDan9
- Veteran
- Posts: 2,707
- And1: 488
- Joined: Sep 30, 2003
Re: RealGM Top 100 List #44
And at this point, when the likes of Mullin and Richmond come into discussion...  we at least have to mention to the player who is
- an MVP,
- a 4-times scoring champion,
- a 7-times All-NBA selection (3-times First Team!)
- a 11-times All-Star etc.
Yes, TS% is a significant metric, but not the alpha and omega of basketball. I would gladly take Iverson over many of the guys already mentioned in these last topics.
- an MVP,
- a 4-times scoring champion,
- a 7-times All-NBA selection (3-times First Team!)
- a 11-times All-Star etc.
Yes, TS% is a significant metric, but not the alpha and omega of basketball. I would gladly take Iverson over many of the guys already mentioned in these last topics.
PC Board All Time Fantasy Draft:
PG Mark Price (92-94)
SG Manu Ginobili (05-07)
SF Larry Bird (84-86)
PF Horace Grant (93-95)
C Dwight Howard (09-11)
+
Bernard King (82-84) Vlade Divac (95-97) Derek Harper (88-90) Dan Majerle (91-93) Josh Smith (10-12)
PG Mark Price (92-94)
SG Manu Ginobili (05-07)
SF Larry Bird (84-86)
PF Horace Grant (93-95)
C Dwight Howard (09-11)
+
Bernard King (82-84) Vlade Divac (95-97) Derek Harper (88-90) Dan Majerle (91-93) Josh Smith (10-12)
RealGM Top 100 List #44
-
DQuinn1575
- Sixth Man
- Posts: 1,932
- And1: 705
- Joined: Feb 20, 2014
RealGM Top 100 List #44
Sam jones was second best player on 5 championship teams and contributor to many more. He was top 5 in mvp voting, and kept off of 1st team all-pro by Oscar and west.
Far more career impact on championships than any player left.
Vote Sam jones
Sent from my iPhone using RealGM Forums
Far more career impact on championships than any player left.
Vote Sam jones
Sent from my iPhone using RealGM Forums
Re: RealGM Top 100 List #44
-
Witzig-Okashi

- Rookie
- Posts: 1,125
- And1: 379
- Joined: Nov 24, 2013
- Location: Georgia, USA
-

Re: RealGM Top 100 List #44
Not a participant in this list (lack of time and lack of suitable knowledge are my main problems  ), but I would like to ask when a person like Tiny Archibald will begin to gain traction. Seeing his name in the Bob Ryan-Isiah post made me ponder about him. I doubt he'll make top 50, but where is he fitting on ya'll's top 100?
"Everybody eats"
-Bradley Beal
"*Sigh* The things I do for love."
-Courage the Cowardly Dog
-Bradley Beal
"*Sigh* The things I do for love."
-Courage the Cowardly Dog
Re: RealGM Top 100 List #44
-
Quotatious
- Retired Mod
- Posts: 16,999
- And1: 11,142
- Joined: Nov 15, 2013
Re: RealGM Top 100 List #44
Witzig-Okashi wrote:Not a participant in this list (lack of time and lack of suitable knowledge are my main problems
I can see Tiny making my top 55. I'm really high on his peak (1972-73 - 34 points/11 assists on very good efficiency for his time, which translated to the best offense in the NBA - frankly, I'd take peak Tiny over Isiah and Iverson, as far as little guys are concerned). Not a great longevity as a star, which hurts him, but his prime was pretty good (especially peak). Archibald is in the same category as Kevin Johnson, for me - great peak/prime (comparable/better peak, a bit worse prime than KJ), rather weak longevity. For this reason, I'll probably support KJ somewhere in the late 40s, and Tiny will become a very serious candidate in the early 50s.
Re: RealGM Top 100 List #44
-
tsherkin
- Retired Mod
- Posts: 78,780
- And1: 20,211
- Joined: Oct 14, 2003
-
Re: RealGM Top 100 List #44
Tiny should be top 70-ish based on peak. I imagine he'll get in after someone like McAdoo, maybe around Walton?
Re: RealGM Top 100 List #44
-
penbeast0
- Senior Mod - NBA Player Comparisons
- Posts: 28,447
- And1: 8,679
- Joined: Aug 14, 2004
- Location: South Florida
-
Re: RealGM Top 100 List #44
Quotatious wrote:Witzig-Okashi wrote:Not a participant in this list (lack of time and lack of suitable knowledge are my main problems
I can see Tiny making my top 55. I'm really high on his peak (1972-73 - 34 points/11 assists on very good efficiency for his time, which translated to the best offense in the NBA - frankly, I'd take peak Tiny over Isiah and Iverson, as far as little guys are concerned). Not a great longevity as a star, which hurts him, but his prime was pretty good (especially peak). Archibald is in the same category as Kevin Johnson, for me - great peak/prime (comparable/better peak, a bit worse prime than KJ), rather weak longevity. For this reason, I'll probably support KJ somewhere in the late 40s, and Tiny will become a very serious candidate in the early 50s.
Checked on that team offense number and yes, in 1973, Royals had the best offense (and worst defense) in the NBA. However, in the 3 years around that which were also peak Archibald years, they finished 7th/17 (72), 13th/17 (75), and 14th/18 (76) -- Nate played only 35 games in 74 (14th). The main differences were the very efficient (but low scoring) Matt Guokas and Johnny Green on the 2 earlier teams v. flashy gunner Jimmy Walker on the 2 later teams, and a mix of role players moving in and out of the PF position -- in 1973, the great offense/zero defense year, they pulled the D'Antoni trick and used swingman Scott Wedman at PF most of the time giving up rebounding and defense for offensive mismatches. Archibald was also just more explosive before the injury in 74 though his role stayed similar afterwards (except for Jimmy Walker taking more of a second playmaker role).
So, I think just saying Archibald's greatness produced the league's number one offense is overstating the case.
“Most people use statistics like a drunk man uses a lamppost; more for support than illumination,” Andrew Lang.
Re: RealGM Top 100 List #44
-
Quotatious
- Retired Mod
- Posts: 16,999
- And1: 11,142
- Joined: Nov 15, 2013
Re: RealGM Top 100 List #44
penbeast0 wrote:So, I think just saying Archibald's greatness produced the league's number one offense is overstating the case.
I was talking just about his peak season, I'm aware the Royals' offense wasn't very good before or after that.
Re: RealGM Top 100 List #44
-
Owly
- Lead Assistant
- Posts: 5,348
- And1: 3,016
- Joined: Mar 12, 2010
Re: RealGM Top 100 List #44
penbeast0 wrote:Quotatious wrote:Witzig-Okashi wrote:Not a participant in this list (lack of time and lack of suitable knowledge are my main problems
I can see Tiny making my top 55. I'm really high on his peak (1972-73 - 34 points/11 assists on very good efficiency for his time, which translated to the best offense in the NBA - frankly, I'd take peak Tiny over Isiah and Iverson, as far as little guys are concerned). Not a great longevity as a star, which hurts him, but his prime was pretty good (especially peak). Archibald is in the same category as Kevin Johnson, for me - great peak/prime (comparable/better peak, a bit worse prime than KJ), rather weak longevity. For this reason, I'll probably support KJ somewhere in the late 40s, and Tiny will become a very serious candidate in the early 50s.
Checked on that team offense number and yes, in 1973, Royals had the best offense (and worst defense) in the NBA. However, in the 3 years around that which were also peak Archibald years, they finished 7th/17 (72), 13th/17 (75), and 14th/18 (76) -- Nate played only 35 games in 74 (14th). The main differences were the very efficient (but low scoring) Matt Guokas and Johnny Green on the 2 earlier teams v. flashy gunner Jimmy Walker on the 2 later teams, and a mix of role players moving in and out of the PF position -- in 1973, the great offense/zero defense year, they pulled the D'Antoni trick and used swingman Scott Wedman at PF most of the time giving up rebounding and defense for offensive mismatches. Archibald was also just more explosive before the injury in 74 though his role stayed similar afterwards (except for Jimmy Walker taking more of a second playmaker role).
So, I think just saying Archibald's greatness produced the league's number one offense is overstating the case.
Advance notice: This post is floating further off topic, including arguing with people who aren't here. Still, Archibald discussion is going on and the initial response is to Pen. Anyhow ...
It is worth noting that another difference between '73 and the rest is that Archibald is playing over 400 more minutes than any other season.
Of course this was also his best season and so if there's no "what if" leeway allowed then, unless someone is super into peaks, then since, as you note, this result and this level of impact wasn't typical and therefore what this is worth is debateable.
Regardless, there has been a school of thought that you can't win with your pg scoring a lot, which implicitly means you can't have a good O with your pg scoring a lot, since it has nothing to do with D. Archibald and Robertson (and to a lesser degree Magic) destroy this view.
One notable proponent was/is Bill Simmons
The Book of Basketball, on the '73 MVP race wrote:Kareem’s candidacy was crippled by dubious support for Archibald, the first player to lead the league in points and assists—and beyond that, minutes (a jaw-dropping 3,681), field goals, free throws, field goal attempts and free throw attempts—for a 36-win team that missed the playoffs. Can you really be “most valuable” when your team lost 46 freaking games? And don’t get me started on the foolishness of a point guard averaging nearly 27 shots and 10 free throw attempts per game. Isiah could have hogged the ball like that; same for Chris Paul, Kevin Johnson or Tim Hardaway before he blew out his knee. None of them did it. Why? Because it would have killed their teams! They were point guards! We haven’t seen anything like Tiny in ’73 before or since and it’s definitely for the best.
The Book of Basketball, on Tiny wrote:His career is remembered unfairly because everyone mentions the “only guy to lead the league in points and assists in the same year” first, which is like remembering Bruce Springsteen’s career by praising him for selling so many Born in the USA albums. If your point guard sets a dubious record like that, you probably didn’t win that many games (as the ’73 Royals proved by going 36–46).
I think it's rare to have a great offense with a (really) high scoring pg but it depends on the pg. Most wouldn't be able to do it efficiently (i.e. without huge turnovers and misses, which in turn might well annoy teammates and make such volume a bad idea), but just because there aren't many pg's good enough to do it it doesn't make those that do it bad.
An additional note is that obviously regarding the specific league leading thing, scoring leaders don't often tend to have great teammates, so Simmons may be confusing cause and effect (i.e. really there have been great pgs who scored in high volumes and created efficient offenses, and part of the reason they scored so much was teammates weren't so good; but he sees when pg's score a lot a la Robertson and Archibald the teams don't win, so it's not a good idea, even though they struggled on D, and had below par teammates).
Re: RealGM Top 100 List #44
-
ronnymac2

- RealGM
- Posts: 10,890
- And1: 4,881
- Joined: Apr 11, 2008
-


Re: RealGM Top 100 List #44
Vote: Tracy McGrady
T-Mac's quality of prime is Kobe-level though much shorter compared to Bryant. In his prime, he combined amazing pick-n-roll play with low turnovers, 3-point shooting, super-high volume/USG%, and solid defense. He never got to prove it really, but I think his game would flourish next to offensive talent.
His final Toronto year shouldn't be discounted either. He was a really good 2-way player with great rebounding and defensive activity.
Spoiler:
Pay no mind to the battles you've won
It'll take a lot more than rage and muscle
Open your heart and hands, my son
Or you'll never make it over the river
It'll take a lot more than rage and muscle
Open your heart and hands, my son
Or you'll never make it over the river
Re: RealGM Top 100 List #44
-
penbeast0
- Senior Mod - NBA Player Comparisons
- Posts: 28,447
- And1: 8,679
- Joined: Aug 14, 2004
- Location: South Florida
-
Re: RealGM Top 100 List #44
Dolph Schayes – trex_8063
Vince Carter – stherkin
Sam jones – DQuinn1575
Tracy McGrady – ronnymac2
Vince Carter – stherkin
Sam jones – DQuinn1575
Tracy McGrady – ronnymac2
“Most people use statistics like a drunk man uses a lamppost; more for support than illumination,” Andrew Lang.
Re: RealGM Top 100 List #44
-
john248
- Starter
- Posts: 2,367
- And1: 651
- Joined: Jul 06, 2010
-
Re: RealGM Top 100 List #44
My official vote is for Kevin McHale. Much has been said for his variety of post moves. He had a turnaround fadeaway, face-up jump shot, hooks, baseline spins, up and unders, etc...all due to good footwork and took advantage of his length. I don't think he had a variety like Olajuwon or Dantley, but McHale still ranks way up there. Roughly a 20/8/2/2blk guy with 120+ ORTG 11% TOV during his prime over an 8 year stretch. Good defender with good feet and length to disrupt whoever he was guarding.
McHale mainly faced single coverage most of the time since he was on the same team as Bird. The Celtics could stretch things out with Bird and Ainge as great 3 point shooters of that era, and Parish with his mid-range. Known as a black hole too, which again, would stand out more on a team with a passer like Bird and good combo guards in Ainge and DJ; Parish was solid enough in this regard. Granted, McHale wasn't asked to be a passing hub. Not an incredible rebounder either with a career 13.2% TRB; rebounding also didn't go up the year Bird was out in 89. Just 4 years starting but consistently good player from 84-91.
87 was a bit of an outlier year. Celtics bench wasn't particularly strong, and McHale did cover a lot of slack. Finished All-NBA 1st & All-defensive 1st the same year. Had a broken foot which brought his volume down but did well against Worthy on both sides in the Finals. You can argue he was top 5 this year. Also of note is the 1985 Finals where you could argue that McHale was the best on his team that series.
I see McHale as an elite #2 while still being all-defensive on the other end. The later part of his prime where he's averaging 22 PPG on 15 FGA is about the volume I think he could've handled earlier in his career. Legit 2-way player.
Actually waffling between McHale and McGrady now.
The Last Word
Re: RealGM Top 100 List #44
-
RayBan-Sematra

- Assistant Coach
- Posts: 4,236
- And1: 911
- Joined: Oct 03, 2012
Re: RealGM Top 100 List #44
Since McHale is finally starting to get some traction I feel it is time to mention.
***Pau Gasol***

Guy was a great player the moment he entered the league.
-Won ROY averaging : 18 / 9 / 3apg / 2bpg on 57%TS.
-After Rook year he has a 10 year stretch of : 19 / 9 / 3apg / 2bpg on 58%TS.
So that is 11 full years of solid All-Star level production and impact.
Then in 2013 he averaged 14 / 9 / 4apg in the reg-season and 14 / 12 / 7apg in the playoffs.
I feel like he was still potentially an All-Star level guy this year on the right team but he struggled because Dwight forced him out of position. An older Gasol really needed to operate in the low post and Dwight didn't allow this consistently enough. He was often turned into a perimeter shooter.
In 2014 with Dwight gone Gasol went back to averaging 17 / 10 / 3.4apg / 2bpg.
Not bad for his 13th year.
Anyway he has very good longevity for this stage of the project and he has great averages period.
I like to think of Gasol as a slightly lesser version of Mchale.
He wasn't quite the scorer McHale was (though he was still one of the best scorers ever at the PF position) and he probably wasn't quite as good defensively (though he was still a very good defender).
On the other hand Gasol was a much better passer which is very valuable in a team sense and definitely helps minimize whatever edge McHale has offensively.
I think he should probably get in sometime over the next few spots.
Edit ::::
Gasol also has better longevitiy then Mchale.
His 11 year strech of All-Star level production is superior to McHales much shorter 8 year stretch.
***Pau Gasol***
Guy was a great player the moment he entered the league.
-Won ROY averaging : 18 / 9 / 3apg / 2bpg on 57%TS.
-After Rook year he has a 10 year stretch of : 19 / 9 / 3apg / 2bpg on 58%TS.
So that is 11 full years of solid All-Star level production and impact.
Then in 2013 he averaged 14 / 9 / 4apg in the reg-season and 14 / 12 / 7apg in the playoffs.
I feel like he was still potentially an All-Star level guy this year on the right team but he struggled because Dwight forced him out of position. An older Gasol really needed to operate in the low post and Dwight didn't allow this consistently enough. He was often turned into a perimeter shooter.
In 2014 with Dwight gone Gasol went back to averaging 17 / 10 / 3.4apg / 2bpg.
Not bad for his 13th year.
Anyway he has very good longevity for this stage of the project and he has great averages period.
I like to think of Gasol as a slightly lesser version of Mchale.
He wasn't quite the scorer McHale was (though he was still one of the best scorers ever at the PF position) and he probably wasn't quite as good defensively (though he was still a very good defender).
On the other hand Gasol was a much better passer which is very valuable in a team sense and definitely helps minimize whatever edge McHale has offensively.
I think he should probably get in sometime over the next few spots.
Edit ::::
Gasol also has better longevitiy then Mchale.
His 11 year strech of All-Star level production is superior to McHales much shorter 8 year stretch.
Re: RealGM Top 100 List #44
-
Clyde Frazier

- Forum Mod
- Posts: 19,885
- And1: 25,322
- Joined: Sep 07, 2010
Re: RealGM Top 100 List #44
Vote for #44 - Dolph Schayes
http://www.basketball-reference.com/pla ... ydo01.html
- 15 year career
- 12x all NBA (6 1st, 6 2nd)
- 3 top 5 and 3 top 10 MVP finishes
- 1x NBA champion
- Retired having played the most seasons, games and minutes in league history*
*This includes NBL play, which I know technically doesn't count for this project. Let's just leave it as a fun fact. He was an ironman regardless.
My post from last thread (click spoiler):
Schayes’ longevity and consistency throughout his career can be attributed to great mental toughness and work ethic. This is timeless. Per Jeremiah Tax of Sports Illustrated:
http://www.si.com/vault/1957/01/14/5998 ... n-the-mind
Some more insight on his playing style from a SLAM Magazine interview:
I also came across a post from APBRmetrics on comparing eras which was pretty well said:
http://godismyjudgeok.com/DStats/APBRme ... 26734.html
Carter and McGrady were no question 2 of the greatest talents of their generation. Freak athlete playmakers who could do a little bit of everything on the court. I think I give McGrady the benefit of the doubt more than the average fan regarding the 1st round exits. Between his injuries and just not being on great teams for part of his career, I can’t put it all on him. In respect to the project, though, his longevity leaves something to be desired.
The way carter has re-invented himself in his later years is no doubt impressive, but he may have wasted a good chunk of his career having not made that mental transition earlier. It’s a little disconcerting when you see a guy hustle more in his mid to late 30s than he did in his prime. I think both are deserving soon, but have some blotches on their career that make me think twice about them here.
[And of course this is a total what if, but who knows what their legacies look like if they stayed in toronto together.]
http://www.basketball-reference.com/pla ... ydo01.html
- 15 year career
- 12x all NBA (6 1st, 6 2nd)
- 3 top 5 and 3 top 10 MVP finishes
- 1x NBA champion
- Retired having played the most seasons, games and minutes in league history*
*This includes NBL play, which I know technically doesn't count for this project. Let's just leave it as a fun fact. He was an ironman regardless.
My post from last thread (click spoiler):
Spoiler:
Schayes’ longevity and consistency throughout his career can be attributed to great mental toughness and work ethic. This is timeless. Per Jeremiah Tax of Sports Illustrated:
This is Dolph Schayes talking—the 6-foot-8, 220-pound Syracuse National who has been chosen on more All-Star squads than any player in NBA history and whose all-round skill is attested by consistent near-the-top leadership in three areas: allover scoring, the precise art of free throws, and rebounding. To some his words will carry a ring of naivete, which in this instance is, sadly, the price of sincerity:
"The most important thing any athlete does is 'get up' mentally before the competition starts. It's the difference between the ordinary, average performance and the extra effort that wins the game, the race, or whatever he's going to do … A lot of players in our league aren't really trying. Don't get me wrong, they give everything they've got—physically. But they just haven't learned how to get that extra something that comes from being 'up' mentally. The ones I admire most are guys like [Bill] Sharman and [Neil] Johnston. It's the psychological edge they bring along that makes them great."
"Dolph was all adolescent arms and legs in college," says NYU Coach Howard Cann. " He was a good player—no more than that. But his mind was set on being great. He was in the gym practicing every spare minute. We had to chase him out." Today, after seven years as a pro, Schayes is still pushing himself; according to Coach Paul Seymour, they have to turn out the lights at the Syracuse gym where the Nationals practice before he quits for the day.
http://www.si.com/vault/1957/01/14/5998 ... n-the-mind
Some more insight on his playing style from a SLAM Magazine interview:
SLAM: You were a big man who played like a guard. How did you develop those skills?
SCHAYES: By playing in the New York City schoolyards, where the game was all about movement. I happened to be tall, but I learned the fundamentals well—the give and go, setting picks, passing, fast breaks and everything else we called “New York style.” I was a center in college but I was a high-post guy, feeding cutters and rebounding.
SLAM: Your range went out to 30 feet. How many more points would you have averaged with a three-point line?
SCHAYES: Quite a few, but I didn’t score out there as much as people think. My game was slashing to the basket, getting fouled and making three-point plays. But I hit enough deep shots to keep them honest and make them come out. The real secret to my success was I could shoot with either hand.
I also came across a post from APBRmetrics on comparing eras which was pretty well said:
Spoiler:
http://godismyjudgeok.com/DStats/APBRme ... 26734.html
Carter and McGrady were no question 2 of the greatest talents of their generation. Freak athlete playmakers who could do a little bit of everything on the court. I think I give McGrady the benefit of the doubt more than the average fan regarding the 1st round exits. Between his injuries and just not being on great teams for part of his career, I can’t put it all on him. In respect to the project, though, his longevity leaves something to be desired.
The way carter has re-invented himself in his later years is no doubt impressive, but he may have wasted a good chunk of his career having not made that mental transition earlier. It’s a little disconcerting when you see a guy hustle more in his mid to late 30s than he did in his prime. I think both are deserving soon, but have some blotches on their career that make me think twice about them here.
[And of course this is a total what if, but who knows what their legacies look like if they stayed in toronto together.]
Re: RealGM Top 100 List #44
-
lukekarts

- Head Coach
- Posts: 7,168
- And1: 335
- Joined: Dec 11, 2009
- Location: UK
-


Re: RealGM Top 100 List #44
I’m going to start to make a case for Willis Reed here: 7 x All Star, 1 x League MVP, 2 x Finals MVP, 1 x All NBA 1st, 4 x NBA 2nd, 1 x All Defensive 1st, 2 x Championships. He lead the league in Defensive Win Shares and Win Shares too, so the accolades were not ‘hollow’.
Some details around the 1970 finals (remembering Reeds missed some time in this series):
Willis Reed: 23 points / 10.5 rebounds (other Knicks stats: Dave DeBusschere - 19 / 12.6, Dick Barnett - 18.6 / 4.3, Walt Frazier - 17.6 / 10.4 – which includes the inflated/false game 7 assist total).
In the game Reed missed entirely, Wilt scored 45 points and the Lakers won by over 20 points. Wilt averaged 19.3 ppg versus Reed for the rest of the series.
Beyond the boxscore, Willis was revered for his 'intangibles' (which have favoured some players in the poll so far, most recently Zo). He was a very tough character and put his body on the line.
Also, somewhat amusingly: http://ftw.usatoday.com/2014/10/willis- ... kers-fight (some great footage here) - he didn't take any crap
I also checked back at the last top 100 just for a bit of comparison, quite surprising to see how perceptions… or voters, have changed:
34) Artis Gilmore
39) Dwight Howard
43) Willis Reed
45) Dave Cowens
47) Bill Walton
48) Alonzo Mourning
55) Bob Lanier
57) Wes Unseld
66) Nate Thurmond
67) Robert Parish
71) Dikembe Mutombo
81) Ben Wallace
There is no consolation prize. Winning is everything.