DraymondGold wrote:~Thinking Basketball's Actual Jordan Playoff Plus/Minus Data~
Over the holidays, I was able to contact Thinking Basketball, who was kindly willing to share the actual plus minus data from his 'I tracked every Michael Jordan playoff game for a decade' video. This is Jordan's Plus/Minus data for every playoffs from 1988–1998. Of course, full credit goes to Thinking Basketball and the rest of the team that tracked this data. It's due to the ambitious work of basketball historians like TB and Squared2020 that we're able to get this entirely new insight into past players. And plus, learning about the old stats is just fun! So big thanks to the team that tracked this
Here's the raw data copied directly from Ben (I've added commas between column headers for readability) . First the year by year data:Now for the series by series data:Spoiler:And finally the 3-year AuPM approximation:Spoiler:Spoiler:
Now just for readability, here's a summary that's in a slightly more legible format:
Playoffs: Net On/off per 48 minutes (On per 48 minutes, Adjusted On relative to opponent's average MoV per 48 minutes)
1988: +4.3 (-3.7, -0.7)
1989: +24 (+4.2, +9.8)
1990: +33.1 (+7.1, +11.3)
1991: +12.4 (+13.5, +16.4)
1992: +2.1 (+7.1, +11.3)
1993: +10.4 (+7.3, +12.7)
1995: -19.9 (-1.7, +4.1)
1996: +16.2 (+13.1, +18.1)
1997: +21.9 (+8.1, +14.7)
1998: +12.3 (+8.7, +13.8)
3 year AuPM (estimate)
1990: +7.7
1991: +8.7
1992: +7.1
1993: +6.3
1995: +5.5
1996: +5.5
1997: +5.6
1998: +6.7
*note: year listed is the final year, so 1990 means 1988–1990. Why are these an estimate and not the true value? AuPM takes a player's net plus minus data over a timespan (e.g. a playoff run) and estimate their APM/RAPM, without the full play-by-play data needed to actually calculate APM/RAPM. Pros: it's much stabler in small samples, like a playoff run (unlike APM/RAPM), and it does a pretty good job at approximating the long term APM/RAPM. To do this, AuPM needs to approximate the 'adjustment' part of APM/RAPM, without the play-by-play. This requires knowing the total plus minus data of a player's teammates, but since only Jordan's plus minus data was tracked in these playoffs, we don't have that information. Specifically, we apply an adjustment if a player's teammate has a higher value than them. See original article for details (https://thinkingbasketball.net/2017/09/18/augmented-plus-minus-evaluating-old-pm-data/). We can estimate this (e.g. it's super unlikely that someone would have a better on/off in the 1990 postseason... it's super likely that someone has a better on/off in the 1995 postseason) to get realistic AuPM estimates, so that would inform the estimate. Thus this is a most-likely estimate of 3 year AuPM, until we can get the plus minus data for all Jordan's teammates too.
3-year data:Spoiler:
To close, I'll add a little personal analysis here.Spoiler:Hey Jake! Feel free to update the OP if you'd like! Using these actual numbers should be more accurate than our by-eye estimates of the plots. Let me know if you have any questions!lessthanjake wrote:.
This is fantastic info! Thanks for getting it! I will aim to eventually fully update my OP with it. It’d take me a fair bit of time to actually fully do that, because the data is in per-48-minutes terms and I’d tried to convert that to per-100-possessions terms in the OP—which requires pulling some data and making some additional calculations (I unfortunately didn’t keep my original calculations saved in an organized fashion, so that’d make it take longer than it should). And I’m actually not sure anymore that that’s the best way of doing things (since I’ve started to become a bit skeptical of Basketball-Reference’s pace-related data). So if I update the OP with this more precise data, I’m not sure exactly what form it should take (i.e. just leave it in per-48-minute terms or try to convert it to per-100-possession terms). I’m inclined to leave it in per-48-minute terms and just report out the total playoff on-off fully on a per-48-minute basis, in order to avoid potentially serious issues regarding conversion of the data. But that could also be a bit confusing, since some of the other data I’ve cited in the OP for regular season is on a per-100-possession basis, so the post would be using two different types of measuring sticks (not to mention that people are used to per-100-possession on-off values, so it’s not immediately clear exactly how good a number is when reported on a per-48-minute basis). That could be confusing. So I have to think about how best to do it. If you’ve got any particular views on that, I’m certainly happy to hear them! In the meantime, I’ve calculated the per-48-minute data (as per the below) and added that info as a note in my OP (crediting you and Djoker with the extremely helpful info you’ve provided), along with an explanation about how I’m still deciding whether and when to try to convert that to per-100-possession terms. I’ve also added notes in a few places in the OP pointing to the data you reported, as more accurate with regards to the Thinking Basketball data, and noting that the numbers in the rest of the post haven’t actually yet been updated to account for those more accurate numbers.
For now, as alluded to above, we can actually calculate Jordan’s career playoff on-off in per-48-minute terms:
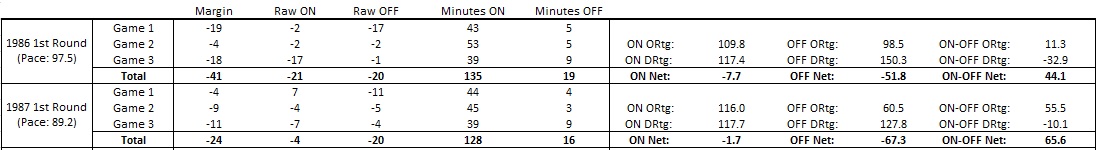
To do this, I’ve taken: (1) the “on” plus-minus, “off” plus-minus, “on” minutes, and “off” minutes you provided above from Thinking Basketball, (2) the “on” and “off” values derived from Squared’s data from the 1984-1985 playoffs (I think he’s taken that data down now—perhaps as a result of arguments on these forums—but I do have record of that, which showed +10 “on” and therefore -32 “off”), (3) the “on” and “off” values for 1986 and 1987 from Djoker’s post (with the correction that Djoker later made after your post—see https://forums.realgm.com/boards/viewtopic.php?p=110650813#p110650813); and (4) the minutes on and off for 1985, 1986, and 1987 from Basketball-Reference.
And I’ve used that data to compile a full per-48-minute on-off for Jordan in the playoffs:
Michael Jordan Career Playoff On-Off Per 48 Minutes
- On: +6.6829 (+1044 in 7498.58333 minutes)
- Off: -7.3914 (-178 in 1155.936667 minutes)
- On-Off per 48 minutes: +14.0743
Very impressive stuff! And, of course, it’s important to recognize that this is in per-48-minute terms. Since there was virtually always fewer than 100 possessions per 48 minutes on average, it is highly likely that the per-100-possession on-off would be a bit higher—without doing the full calculations, a good guess would probably be around a +15 or +16 on-off per 100 possessions (which is consistent with Djoker having calculated a +16.15 per 100 possessions before we got this more precise data).