OhayoKD wrote:Yeah, not sure about those 92 marks:
LA Bird wrote:There is no way that +45 on/off net rating is remotely accurate.
1. Dipper had similarly high on/off estimates for Barkley (+36.3) and Hakeem (+34.5) but those estimates were disproven with Harvey Pollack's full season data.
Hakeem net on/off 1994: +14.5 1995: +9.0 1996: +10.3
In none of the 12 full seasons did they come anywhere near the +35 on/off estimate over the same period.
2. There has only been a handful of +20 on/off net seasons in the last 25 years, none above +25. A +35 or + 45 on/off was never realistic in the first place, especially not by 3 players at the same time in just the few seasons prior. This was most likely just a calculation error somewhere in Dipper's spreadsheet which was repeated when he plugged in new numbers for different players.
Taking it at face value anyway...
Gregoire wrote: Excellent work, man, thanks!
So, MJs career playoffs on-off per 100 poss is 14,7 with 7.55 ON. Maaan... LeBrons is 10,2 with 5,9 ON. Its not close actually the more we use analytical approach and impact data... In regular season I suppose the margin would be even wider because of "coasting".
Make that 2006-2021 Lebron and the playoff stuff is comparable with a 1994 Bull-sized elephant missing and the regular-season stuff being comparable without 94 or the bulk of 95.
That is also despite Lebron playing a much larger minute sample and staggering significantly more with co-stars.
IOW, nice try
I'm a bit confused, is the 1995 playoffs included in the sample??u said lebron has a comparable value in the playoffs from 2006 to 2021 which is essentially jordan entire playoff range. A source will be nice on that including the minutes disparity of their various co stars
1995 playoffs are, 1995 regular season without mj is not. Nor are the 94 playoffs or regular season. I don't know what it would look like with the exact same minutes, but similar season-count has been done before: Jordan mantains a small edge with a consecutive approach over less minutes using this data. Make of that what you will.
its my last message in this thread, but I just admit, that all the people, casual and analytical minds, more or less have consencus who has the weight of a rubberized duck. And its not JaivLLLL
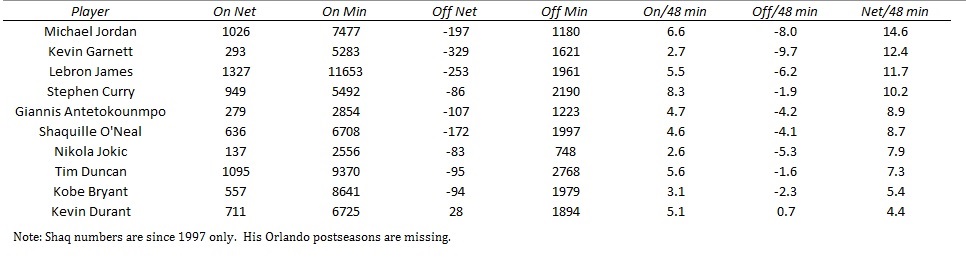
eminence wrote:Ya know, I'm not fully up on what these numbers would look like /48 for other notables (Shaq/Duncan/KG/LeBron/Steph maybe?).
Anybody have any of those sitting around?
Here you go!
I thought it might be interesting to look at 5-year Runs! This might give us a sense of players' (extended) peaks. It might be slightly longer than people's preferred peak timespan (e.g. many prefer ~3 year runs), but given the noise of raw on/off and the small sample sizes of shorter playoff runs, it might give us a more consistent signal. Note: I'm using a threshold of 1000 on-minutes and 300 off-minutes, which are pretty standard values (they don't cut out many runs from the all-time greats, they really only cut out the shortest playoff runs usually from sub-All NBA level players).
For context, here are some alternate time frames / samples for the MVP/All-NBA players:
Spoiler:
- [85-89 Jordan +28.8, but only 212 off minutes] - [86-90 Jordan +25.7, but only 285 off minutes] -[18-22 Embiid +22.8, only games played] - [15-19 Healthy Curry +15.8, only games played when healthy] -[17-23 Curry +15.6, only games played_ - [88-92 Jordan 14.4] - [89-93 Jordan 14.4] -13-17 Curry (+14.4, only games played) - [15-20 LeBron 14.2] - [14-18 LeBron 13.8] - [07-11 LeBron +13.1] - 19-23 Giannis (+13.0, only games played) - 15-19 Curry (+12.8, only games played) - 14-18 Paul (+12.7, only games played) - [12-16 LeBron +12.2] - [93-98 Jordan +10.6] - 14-19 Durant (10.3, only games played) - [09-13 LeBron +8.9] - 15-19 Curry (+8.4, all games) - 06-13 Nash (+8.4, only games played) - 14-19 Kawhi (+6.8, games played)
Notes: Again, there's a 1000 on-minute and 300 off-minute threshold for the win list. The uncertainty in 87-91 Jordan comes from the slight discrepancy in the hand-tracking values from different sources (see earlier posts in this thread). For players who missed games in the playoffs (Giannis, Curry, Paul, Durant, Nash), missing games can cause bias: missing games in the early rounds can artificially deflate your on/off (because your team had an easier schedule when you were off), while missing games in the later rounds can artificially inflate your on/off (because your team had a harder schedule when you were off). This is distinct from the regular season, when missing a handful of games often comes against random teams and so the difficulty of schedule balances out, and there's a large off-sample in the games you did play regardless. In the alternate samples list, I filter for their on/off only using the games they played in for the Off data.
I also did a cursory search for the 5-year Playoff On/off for all sub-All NBA players who had a 3-year Playoff On/off of 18+ (i.e. a top ~50 run, which is roughly 20 distinct players). In general, with more data and thus more signal, fewer of the sub-All NBA players snuck into the top ranks in the 5-year PS On/off compared to 3-year. The sense I get is I probably got most of the very top players (my bet would be nobody passes Shaq or Jordan in the top 2), but there definitely could be a few players around +14–18 on/off that I missed. Regardless, here are the top 5-year On/off Per 48 runs (I could find) for the sub-All NBA players:
Spoiler:
Other players with high 5-year On/Off per 48: 1. 12-17 George Hill (18.4) (would be 3rd overall, below Jordan and above LeBron) 2. 02-12 Baron Davis (17.6) 3. 19-23 Seth Curry (16.9) 4. 12-16 Kyle Korver (15.8) 5. 15-19 Kyle Lowry (14.9) 6. 15-23 Jrue Holiday (14.9)
Some thoughts: -Shaq being first is a bit surprising! He has the reputation of being the consensus 3rd best peak of all time after Jordan/LeBron, but often the impact metrics is marginally lower on him. This is the first peak metric I've found that puts Shaq at this level. In general, Shaq has one of the biggest improvements going from RS -> PS on/off. He was a playoff improver (i.e. a regular season coaster), so I guess this makes sense. But it makes me wonder: if we did a larger analysis of other impact metrics (e.g. 5-year AuPM or PIPM or RAPM) in the playoffs only, would that continue to support Shaq having a a truly GOAT tier peak? Or would arguing for Shaq's peak dominance continue to rely on analyzing peak team performance or film analysis?
-It should be obvious that Jordan has a GOAT tier peak, and the data unsurprisingly continues to support this. He's clearly 2nd all time in the playoffs, within uncertainty range of 1st, with available regular season data also being better than the players in 1st and 3rd. He actually looks even better in his younger years in on/off (just 1 season earlier from 86–90 gives him +25.7 and he has 28.8 in 85-89!). Some of this is definitely boosted by noise, but he also had some crazy-good (albeit short -> higher uncertainty) runs as early as 86. If there is any signal here, did the shorter runs against a known much better opponent push him to really go all-out with his motor in a way that might not have been sustainable or necessary in a deeper run with better teammates? Here, being pre-2003 limits our confidence a bit, since first round series were best of 5 rather than best of 7 (he lost in 4 in 85, 3 in 86, 3 in 87). If they had first round best of 7s, the 1986–1990 sample would definitely have a large enough off sample to include in the list: based on his MP, we'd expect him to have 25 more off minutes (so 310 off-minutes total) even if he played the bare minimum 1 extra game per year (although he could have also won and extended the 1st round series too). Hard to know how the early-career numbers would change with a few extra games. My naive guess would be down, but who knows.
-Stockton, Manu, Paul George, Robinson, Draymond, Jrue Holiday all look pretty good. Indeed the secondary stars seem to look better than the primary stars: Robinson and Manu > Duncan, Draymond > Curry (although filtering for when Curry's healthy has Healthy Curry > Draymond), Jrue > Giannis, and Westbrook > Durant. It's interesting... I wonder how much is this from the secondary stars having more value in their role (but not being better overall) vs noise vs getting an extra boost by having most of their minutes aligned with the main star?
-Some surprising highs: Embiid's high rating is pretty surprising, and indeed he improves even more when we filter just for the games he played in. Is his reputation as a playoff choker overstating his decline, is this noise, or is there some other explanation?
-Health changes: Curry rises the most when we filter for games played, and rises more when we filter out games he played through injury. It would be interesting to do this 'only games when playing healthy' filter for a few other players who tend to get injured then play through injury in the playoffs.
-Some surprising lows: Chris Paul usually is very close to the top in RS impact metrics, but has a reputation for not being quite as valuable in the playoffs (is this just health or is there more here?). The on/off supports that. Kobe has a reputation of being surprisingly low in impact metrics, and that trend continues here. Kawhi has a reputation of being a huge playoff improver, but his playoff on/off is surprisingly pedestrian, even after accounting for games played. And finally Jokic is surprisingly low compared to his regular season reputation -- we'll see how much he improves with another peak postseason under his belt.
Anyway, let me know if anything else stands out to people! In the future, it might also be interesting to look at 3/4 year peaks and 8/10 year primes, although it takes a lot of work to gather all the data.
eminence wrote:Ya know, I'm not fully up on what these numbers would look like /48 for other notables (Shaq/Duncan/KG/LeBron/Steph maybe?).
Anybody have any of those sitting around?
Here you go!
I thought it might be interesting to look at 5-year Runs! This might give us a sense of players' (extended) peaks. It might be slightly longer than people's preferred peak timespan (e.g. many prefer ~3 year runs), but given the noise of raw on/off and the small sample sizes of shorter playoff runs, it might give us a more consistent signal. Note: I'm using a threshold of 1000 on-minutes and 300 off-minutes, which are pretty standard values (they don't cut out many runs from the all-time greats, they really only cut out the shortest playoff runs usually from sub-All NBA level players).
For context, here are some alternate time frames / samples for the MVP/All-NBA players:
Spoiler:
- [85-89 Jordan +28.8, but only 212 off minutes] - [86-90 Jordan +25.7, but only 285 off minutes] -[18-22 Embiid +22.8, only games played] - [15-19 Healthy Curry +15.8, only games played when healthy] - [88-92 Jordan 14.4] - [89-93 Jordan 14.4] - [15-20 LeBron 14.2] - [14-18 LeBron 13.8] - [07-11 LeBron +13.1] 17. 19-23 Giannis (+13.0, only games played) 18. 15-19 Curry (+12.8, only games played) 19. 14-18 Paul (+12.7, only games played) - [12-16 LeBron +12.2] - [93-98 Jordan +10.6] 20. 14-19 Durant (10.3, only games played) - [09-13 LeBron +8.9] 22. 06-13 Nash (+8.4, only games played) 24. 14-19 Kawhi (+6.8, games played)
Notes: Again, there's a 1000 on-minute and 300 off-minute threshold for the win list. The uncertainty in 87-91 Jordan comes from the slight discrepancy in the hand-tracking values from different sources (see earlier posts in this thread). For players who missed games in the playoffs (Giannis, Curry, Paul, Durant, Nash), missing games can cause bias: missing games in the early rounds can artificially deflate your on/off (because your team had an easier schedule when you were off), while missing games in the later rounds can artificially inflate your on/off (because your team had a harder schedule when you were off). This is distinct from the regular season, when missing a handful of games often comes against random teams and so the difficulty of schedule balances out, and there's a large off-sample in the games you did play regardless. In the alternate samples list, I filter for their on/off only using the games they played in for the Off data.
I also did a cursory search for the 5-year Playoff On/off for all sub-All NBA players who had a 3-year Playoff On/off of 18+ (i.e. a top ~50 run, which is roughly 20 distinct players). In general, with more data and thus more signal, fewer of the sub-All NBA players snuck into the top ranks in the 5-year PS On/off compared to 3-year. The sense I get is I probably got most of the very top players (my bet would be nobody passes Shaq or Jordan in the top 2), but there definitely could be a few players around +14–18 on/off that I missed. Regardless, here are the top 5-year On/off Per 48 runs (I could find) for the sub-All NBA players:
Spoiler:
Other players with high 5-year On/Off per 48: 1. 12-17 George Hill (18.4) (would be 3rd overall, below Jordan and above LeBron) 2. 02-12 Baron Davis (17.6) 3. 19-23 Seth Curry (16.9) 4. 12-16 Kyle Korver (15.8) 5. 15-19 Kyle Lowry (14.9) 6. 15-23 Jrue Holiday (14.9)
Some thoughts: -Shaq being first is a bit surprising! He has the reputation of being the consensus 3rd best peak of all time after Jordan/LeBron, but often the impact metrics is marginally lower on him. This is the first peak metric I've found that puts Shaq at this level. In general, Shaq has one of the biggest improvements going from RS -> PS on/off. He was a playoff improver (i.e. a regular season coaster), so I guess this makes sense. But it makes me wonder: if we did a larger analysis of other impact metrics (e.g. 5-year AuPM or PIPM or RAPM) in the playoffs only, would that continue to support Shaq having a a truly GOAT tier peak? Or would arguing for Shaq's peak dominance continue to rely on analyzing peak team performance or film analysis?
-It should be obvious that Jordan has a GOAT tier peak, and the data unsurprisingly continues to support this. He's clearly 2nd all time in the playoffs, within uncertainty range of 1st, with available regular season data also being better than the players in 1st and 3rd. He actually looks even better in his younger years in on/off (just 1 season earlier from 86–90 gives him +25.7 and he has 28.8 in 85-89!). Some of this is definitely boosted by noise, but he also had some crazy-good (albeit short -> higher uncertainty) runs as early as 86. If there is any signal here, did the shorter runs against a known much better opponent push him to really go all-out with his motor in a way that might not have been sustainable or necessary in a deeper run with better teammates? Here, being pre-2003 limits our confidence a bit, since first round series were best of 5 rather than best of 7 (he lost in 4 in 85, 3 in 86, 3 in 87). If they had first round best of 7s, the 1986–1990 sample would definitely have a large enough off sample to include in the list: based on his MP, we'd expect him to have 25 more off minutes (so 310 off-minutes total) even if he played the bare minimum 1 extra game per year (although he could have also won and extended the 1st round series too). Hard to know how the early-career numbers would change with a few extra games. My naive guess would be down, but who knows.
-Stockton, Manu, Paul George, Robinson, Draymond, Jrue Holiday all look pretty good. Indeed the secondary stars seem to look better than the primary stars: Robinson and Manu > Duncan, Draymond > Curry (although filtering for when Curry's healthy has Healthy Curry > Draymond), Jrue > Giannis, and Westbrook > Durant. It's interesting... I wonder how much is this from the secondary stars having more value in their role (but not being better overall) vs noise vs getting an extra boost by having most of their minutes aligned with the main star?
-Some surprising highs: Embiid's high rating is pretty surprising, and indeed he improves even more when we filter just for the games he played in. Is his reputation as a playoff choker overstating his decline, is this noise, or is there some other explanation?
-Health changes: Curry rises the most when we filter for games played, and rises more when we filter out games he played through injury. It would be interesting to do this 'only games when playing healthy' filter for a few other players who tend to get injured then play through injury in the playoffs.
-Some surprising lows: Chris Paul usually is very close to the top in RS impact metrics, but has a reputation for not being quite as valuable in the playoffs (is this just health or is there more here?). The on/off supports that. Kobe has a reputation of being surprisingly low in impact metrics, and that trend continues here. Kawhi has a reputation of being a huge playoff improver, but his playoff on/off is surprisingly pedestrian, even after accounting for games played. And finally Jokic is surprisingly low compared to his regular season reputation -- we'll see how much he improves with another peak postseason under his belt.
Anyway, let me know if anything else stands out to people! In the future, it might also be interesting to look at 3/4 year peaks and 8/10 year primes, although it takes a lot of work to gather all the data.
Fantastic post! Though, a lot of people are gonna run away with that Curry number without additional data sadly. Wondering, if this is all done using BBRef, how were you able to sort adjust for his missed games and find the off value of Golden State excluding those games?
Thanks NoParticular!
Agreed about Curry -- his impact data actually looks fantastic even in the playoffs if you just look at when he's healthy. I wanted to give that extra context and other interesting samples for a lot of players (e.g. missing playoff games against easy vs hard teams in a playoff run can bias your on/off for a lot of players; people probably think LeBron peaked earlier than 16-21 even if that's his best on/off run; etc.). But at the same time, I didn't want to over-crowd the list, so I put it in that separate list.
On/off is a noisy enough stat that we should definitely be looking at it in context (e.g. opponent / team). Hopefully this is obvious enough that no one misses the context and just quotes the raw playoff on/off for Curry as a critique for him, but there's plenty of Curry haters out there, so it wouldn't shock me. Either way, it's a pretty easy correction to make ("hey off sample is dominated by first-round games that he missed while the on sample is dominated by later round games he played... maybe we should account for that!").
Unfortunately BBRef doesn't do on/off per 48 minute (only per 100 possessions) or healthy filters, as you noted! I used one of the standard sources for accurate plus minus data instead (pbpstats.com). You can find data for the players by going to pbpstats.com -> on/off -> Wowy (by which they mean on/off, not WOWY the game-level plus minus) -> then choosing the team/player to be on/off -> Get team stats. This just gives us a player's total "On" and "Off" and their minutes, and from there we can get the On/off by using the formula:
On/off per 48 minutes = On per 48 - Off Per 48 = [(total ON points)*(48 minute)/(total ON minute)] - [(total OFF points)*(48 minute)/(total OFF minute)].
Pbpstats doesn't go before 2001 for some reason, so I had to use nba.com for the total plus minus data before that year. It's a bit unnecessarily intensive, but I wasn't sure of an easier way to get a players' total On and Off.
Back to Curry, pbpstats actually has a filter to only include games where someone played when Calculating the Off (on that same Wowy page: Add player Filter -> Exactly 1 of Stephen Curry Played in Game). I used the same filter to get the other players' "only games played" value. To get the extra Healthy Curry filter, I filtered out the games he played through injury in 2016. Since everyone agreed he was playing injured at the time, and quotes have confirmed later on he was playing through injury, that seemed fair. I had to do this manually: since he only played 1 fully healthy game before injury in 2016 playoffs, I just used that game's On and Off for the 2016 run. It's unfortunately a pretty small sample size for a single playoff run (how good would that team have been with a fully healthy Curry??), but that still gives us nearly 3000 on-minutes and over 800 off minutes in the full 5-year healthy run. Plus if anyone complains, adding either of the neighboring samples (2014 playoffs or 2021 play-ins) would actually improve the playoff on/off.
Sorry for the long explanation, but hopefully that covers everything!
“Why do people say Curry is not resilient? Btw I think he alone deserves injury adjustments and that only one postseason game from his peak season — even though he was demonstrably more productive than he was two postseasons earlier — should count.”
AEnigma wrote:“Why do people say Curry is not resilient? Btw I think he alone deserves injury adjustments and that only one postseason game from his peak season — even though he was demonstrably more productive than he was two postseasons earlier — should count.”
Was thinking of a similar adjustment for Lebron by the way
Process:
-> Filter out last three games of 2010,
-> Filter out all of 2015
-> Filter out last three games of 2018
-> May as well filter out 2011. because Lebron was adjusting to a new weight and obviously that is not fair to include
Thoughts?
its my last message in this thread, but I just admit, that all the people, casual and analytical minds, more or less have consencus who has the weight of a rubberized duck. And its not JaivLLLL
DraymondGold wrote: I thought it might be interesting to look at 5-year Runs! This might give us a sense of players' (extended) peaks. It might be slightly longer than people's preferred peak timespan (e.g. many prefer ~3 year runs), but given the noise of raw on/off and the small sample sizes of shorter playoff runs, it might give us a more consistent signal. Note: I'm using a threshold of 1000 on-minutes and 300 off-minutes, which are pretty standard values (they don't cut out many runs from the all-time greats, they really only cut out the shortest playoff runs usually from sub-All NBA level players).
For context, here are some alternate time frames / samples for the MVP/All-NBA players:
Spoiler:
- [85-89 Jordan +28.8, but only 212 off minutes] - [86-90 Jordan +25.7, but only 285 off minutes] -[18-22 Embiid +22.8, only games played] - [15-19 Healthy Curry +15.8, only games played when healthy] - [88-92 Jordan 14.4] - [89-93 Jordan 14.4] - [15-20 LeBron 14.2] - [14-18 LeBron 13.8] - [07-11 LeBron +13.1] 17. 19-23 Giannis (+13.0, only games played) 18. 15-19 Curry (+12.8, only games played) 19. 14-18 Paul (+12.7, only games played) - [12-16 LeBron +12.2] - [93-98 Jordan +10.6] 20. 14-19 Durant (10.3, only games played) - [09-13 LeBron +8.9] 22. 06-13 Nash (+8.4, only games played) 24. 14-19 Kawhi (+6.8, games played)
Notes: Again, there's a 1000 on-minute and 300 off-minute threshold for the win list. The uncertainty in 87-91 Jordan comes from the slight discrepancy in the hand-tracking values from different sources (see earlier posts in this thread). For players who missed games in the playoffs (Giannis, Curry, Paul, Durant, Nash), missing games can cause bias: missing games in the early rounds can artificially deflate your on/off (because your team had an easier schedule when you were off), while missing games in the later rounds can artificially inflate your on/off (because your team had a harder schedule when you were off). This is distinct from the regular season, when missing a handful of games often comes against random teams and so the difficulty of schedule balances out, and there's a large off-sample in the games you did play regardless. In the alternate samples list, I filter for their on/off only using the games they played in for the Off data.
I also did a cursory search for the 5-year Playoff On/off for all sub-All NBA players who had a 3-year Playoff On/off of 18+ (i.e. a top ~50 run, which is roughly 20 distinct players). In general, with more data and thus more signal, fewer of the sub-All NBA players snuck into the top ranks in the 5-year PS On/off compared to 3-year. The sense I get is I probably got most of the very top players (my bet would be nobody passes Shaq or Jordan in the top 2), but there definitely could be a few players around +14–18 on/off that I missed. Regardless, here are the top 5-year On/off Per 48 runs (I could find) for the sub-All NBA players:
Spoiler:
Other players with high 5-year On/Off per 48: 1. 12-17 George Hill (18.4) (would be 3rd overall, below Jordan and above LeBron) 2. 02-12 Baron Davis (17.6) 3. 19-23 Seth Curry (16.9) 4. 12-16 Kyle Korver (15.8) 5. 15-19 Kyle Lowry (14.9) 6. 15-23 Jrue Holiday (14.9)
Some thoughts: -Shaq being first is a bit surprising! He has the reputation of being the consensus 3rd best peak of all time after Jordan/LeBron, but often the impact metrics is marginally lower on him. This is the first peak metric I've found that puts Shaq at this level. In general, Shaq has one of the biggest improvements going from RS -> PS on/off. He was a playoff improver (i.e. a regular season coaster), so I guess this makes sense. But it makes me wonder: if we did a larger analysis of other impact metrics (e.g. 5-year AuPM or PIPM or RAPM) in the playoffs only, would that continue to support Shaq having a a truly GOAT tier peak? Or would arguing for Shaq's peak dominance continue to rely on analyzing peak team performance or film analysis?
-It should be obvious that Jordan has a GOAT tier peak, and the data unsurprisingly continues to support this. He's clearly 2nd all time in the playoffs, within uncertainty range of 1st, with available regular season data also being better than the players in 1st and 3rd. He actually looks even better in his younger years in on/off (just 1 season earlier from 86–90 gives him +25.7 and he has 28.8 in 85-89!). Some of this is definitely boosted by noise, but he also had some crazy-good (albeit short -> higher uncertainty) runs as early as 86. If there is any signal here, did the shorter runs against a known much better opponent push him to really go all-out with his motor in a way that might not have been sustainable or necessary in a deeper run with better teammates? Here, being pre-2003 limits our confidence a bit, since first round series were best of 5 rather than best of 7 (he lost in 4 in 85, 3 in 86, 3 in 87). If they had first round best of 7s, the 1986–1990 sample would definitely have a large enough off sample to include in the list: based on his MP, we'd expect him to have 25 more off minutes (so 310 off-minutes total) even if he played the bare minimum 1 extra game per year (although he could have also won and extended the 1st round series too). Hard to know how the early-career numbers would change with a few extra games. My naive guess would be down, but who knows.
-Stockton, Manu, Paul George, Robinson, Draymond, Jrue Holiday all look pretty good. Indeed the secondary stars seem to look better than the primary stars: Robinson and Manu > Duncan, Draymond > Curry (although filtering for when Curry's healthy has Healthy Curry > Draymond), Jrue > Giannis, and Westbrook > Durant. It's interesting... I wonder how much is this from the secondary stars having more value in their role (but not being better overall) vs noise vs getting an extra boost by having most of their minutes aligned with the main star?
-Some surprising highs: Embiid's high rating is pretty surprising, and indeed he improves even more when we filter just for the games he played in. Is his reputation as a playoff choker overstating his decline, is this noise, or is there some other explanation?
-Health changes: Curry rises the most when we filter for games played, and rises more when we filter out games he played through injury. It would be interesting to do this 'only games when playing healthy' filter for a few other players who tend to get injured then play through injury in the playoffs.
-Some surprising lows: Chris Paul usually is very close to the top in RS impact metrics, but has a reputation for not being quite as valuable in the playoffs (is this just health or is there more here?). The on/off supports that. Kobe has a reputation of being surprisingly low in impact metrics, and that trend continues here. Kawhi has a reputation of being a huge playoff improver, but his playoff on/off is surprisingly pedestrian, even after accounting for games played. And finally Jokic is surprisingly low compared to his regular season reputation -- we'll see how much he improves with another peak postseason under his belt.
Anyway, let me know if anything else stands out to people! In the future, it might also be interesting to look at 3/4 year peaks and 8/10 year primes, although it takes a lot of work to gather all the data.
Fantastic post! Though, a lot of people are gonna run away with that Curry number without additional data sadly. Wondering, if this is all done using BBRef, how were you able to sort adjust for his missed games and find the off value of Golden State excluding those games?
Thanks NoParticular!
Agreed about Curry -- his impact data actually looks fantastic even in the playoffs if you just look at when he's healthy. I wanted to give that extra context and other interesting samples for a lot of players (e.g. missing playoff games against easy vs hard teams in a playoff run can bias your on/off for a lot of players; people probably think LeBron peaked earlier than 16-21 even if that's his best on/off run; etc.). But at the same time, I didn't want to over-crowd the list, so I put it in that separate list.
On/off is a noisy enough stat that we should definitely be looking at it in context (e.g. opponent / team). Hopefully this is obvious enough that no one misses the context and just quotes the raw playoff on/off for Curry as a critique for him, but there's plenty of Curry haters out there, so it wouldn't shock me. Either way, it's a pretty easy correction to make ("hey off sample is dominated by first-round games that he missed while the on sample is dominated by later round games he played... maybe we should account for that!").
Unfortunately BBRef doesn't do on/off per 48 minute (only per 100 possessions) or healthy filters, as you noted! I used one of the standard sources for accurate plus minus data instead (pbpstats.com). You can find data for the players by going to pbpstats.com -> on/off -> Wowy (by which they mean on/off, not WOWY the game-level plus minus) -> then choosing the team/player to be on/off -> Get team stats. This just gives us a player's total "On" and "Off" and their minutes, and from there we can get the On/off by using the formula:
On/off per 48 minutes = On per 48 - Off Per 48 = [(total ON points)*(48 minute)/(total ON minute)] - [(total OFF points)*(48 minute)/(total OFF minute)].
Pbpstats doesn't go before 2001 for some reason, so I had to use nba.com for the total plus minus data before that year. It's a bit unnecessarily intensive, but I wasn't sure of an easier way to get a players' total On and Off.
Back to Curry, pbpstats actually has a filter to only include games where someone played when Calculating the Off (on that same Wowy page: Add player Filter -> Exactly 1 of Stephen Curry Played in Game). I used the same filter to get the other players' "only games played" value. To get the extra Healthy Curry filter, I filtered out the games he played through injury in 2016. Since everyone agreed he was playing injured at the time, and quotes have confirmed later on he was playing through injury, that seemed fair. I had to do this manually: since he only played 1 fully healthy game before injury in 2016 playoffs, I just used that game's On and Off for the 2016 run. It's unfortunately a pretty small sample size for a single playoff run (how good would that team have been with a fully healthy Curry??), but that still gives us nearly 3000 on-minutes and over 800 off minutes in the full 5-year healthy run. Plus if anyone complains, adding either of the neighboring samples (2014 playoffs or 2021 play-ins) would actually improve the playoff on/off.
Sorry for the long explanation, but hopefully that covers everything!
Edit: Just realized I put my preferred peak for Curry (15-19) rather than his actual 5-year PS on/off peak (17-23). I've edited the original list, and moved the 15-19 stretch to the supplemental samples, but for clarity:
13-17 Curry: +10.6 13-17 Curry, only games played: +14.4 15-19 Curry: +8.4 15-19 Curry, only games played: +12.8 15-19 Curry, only games played Healthy: +15.8 17-23 Curry: +12.0 17-23 Curry, only goes played: +15.6
Also lol at AENigma's troll comment -- my actual post explicitly says we should do this for more players, but as usual AEnigma would rather strawman others and ignore actual content than have a productive discussion. It's a shame people prefer to troll than have actual discourse; I pretty clearly state in my OG post this is not the primary sample for Curry, and is done as a supplemental sample to provide more of that ~context~ Eh, given the history, I don't expect any more productive discourse from them, so this is probably the last I'll engage with any of that line of thinking. Just wanted to specifically note for others reading that they're strawmanning. For others, feel free to engage with the actual OG post if you have any more thoughts!
My thought is that if a player needs serious health filtering to that degree — and again, an apparently insincere one with your gesture at 2014 qualifying as a suitable replacement — then that speaks to their own limits.
Is Curry meaningfully ahead of “injury filtered” Giannis at that point? Injury filtered Embiid and Kawhi I am sure have some massively high on/off samples. It is not a strawman when it is exactly what you sought to do for your favourite player and your favourite player alone, but I suppose that has never stopped you from throwing out fallacies you do not understand, and I should know better than to expect you to have learned.
It seems like it turns out injury filtering is kind of irrelevant here, given that Curry actually has a different five-playoff stretch that is essentially the same as the injury-filtered stretch (+15.6 vs. +15.8)—at least when it comes to games actually played (which is the apples-to-apples comparison with virtually all these other stretches, since missing playoff games is rare).
Anyways, this is great information, and I really appreciate the effort! I do think playoff on-off in even a five-playoff span is surely quite noisy though. Even over 5 playoffs, the “off” sample is generally going to be somewhat low—even for players who had deep playoff runs, I think we’re talking about samples that are roughly equivalent to one regular season (and, in many cases, less than that). And single-season on-off is definitely noisy. So I think we should understand this data as having roughly the same kind of confidence interval as single-season on-off.
OhayoKD wrote:Lebron contributes more to all the phases of play than Messi does. And he is of course a defensive anchor unlike messi.
lessthanjake wrote:It seems like it turns out injury filtering is kind of irrelevant here, given that Curry actually has a different five-playoff stretch that is essentially the same as the injury-filtered stretch (+15.6 vs. +15.8)—at least when it comes to games actually played (which is the apples-to-apples comparison with virtually all these other stretches, since missing playoff games is rare).
Anyways, this is great information, and I really appreciate the effort! I do think playoff on-off in even a five-playoff span is surely quite noisy though. Even over 5 playoffs, the “off” sample is generally going to be somewhat low—even for players who had deep playoff runs, I think we’re talking about samples that are roughly equivalent to one regular season (and, in many cases, less than that). And single-season on-off is definitely noisy. So I think we should understand this data as having roughly the same kind of confidence interval as single-season on-off.
Thanks jake! Totally agreed on noise. The sample of off minutes can frequently be even smaller than a single-season run, and even putting aside biased injury samples for a sec, an uneven distribution of opponents faced can also add noise.
There's obvious value in knowing how a player's impact (in any metric) looks against the best competition, since you'll probably have to face some of the best competition to win a championship, which is what most people care about. So there's a lot of potential if we can find the signal in playoff impact metrics. But not all opponents faced, even in a 5-year span, are equal. And even outside the average quality of your opponent, you can still get a few easy or hard matchups that happen to inflate or deflate your measured value in a raw stat like on/off.
As a result, I think a players' best 5-year run in postseason on/off per 48 is definitely not always their true best 5 year run, even if there is a signal that gets at some of their true value. I absolutely do not think 2021 is peak LeBron, despite it being the clear best run by some margin according to On/off. And likewise, I don't think 16-21 is LeBron's 5-year PS peak, despite On/off claiming that to be the case. The same is true for Jordan: I don't have rookie Jordan as peak Jordan, and I have 1992 Jordan > 1986 Jordan despite the on/off. For Curry, I probably have 15-19 as his best 5-year run, not 17-23. I have 05 Nash > 13 Nash, and 06 Kobe > 11 Kobe, despite on/off.
So I definitely don't think these are definitive or anything. But if given enough sample size (and appropriate context), they can be useful to start getting an order-of-magnitude estimate for players' playoff value (remembering uncertainty bars as always). I'll note that a lot of these 5-year spans happen to include what we usually consider to be their best playoff run, even if the the other years don't align with our prior. LeBron's sample includes 16 which is one of his most valuable runs. Jordan's best run (with the off minute threshold) includes his full standard peak in 88/89–91. Curry includes 17, Nash includes 07. Shaq, Duncan, and Dirk are actually pretty spot on for what we'd expect their peak years to be, with Shaq being 00-04, Duncan being 99-04, and Dirk being 07-11.
As for comparisons between players, I think it's interesting that peak Shaq and Jordan come out on top (Shaq's rating gives credence to his supporters saying he's near GOAT level peak in the playoffs; Jordan's playoffs provide more evidence in addition to his GOAT level RS data that he has a GOAT argument for peak). I think it's interesting that Garnett, Duncan, and Curry (filtering for games played) all have basically the same PS on/off, with Dirk not too far behind, and most other first-option stars falling behind. That tracks pretty closely with peoples' priors, although they're probably not outside of uncertainty range and I'm being somewhat intentionally broad with these trends.
We can probably adjust for some of the flaws in ON/off using context or mores stats. For Curry for instance, filtering out his injured games in just 1 playoff run when we know he was injured or incorporating ON, we see that his 15-19 run is actually at the same level (or barely sneaks ahead of) his other on/off peak in 17-23. If we incorporate the 5-year plus minus (On) per 48, that might help get 92 Jordan > 86 Jordan, younger LeBron > 21 LeBron, etc. More advanced stats like AuPM would presumably be even more accurate, although far from perfect.
But yeah, despite the uncertainty in this approach, it's interesting to examine now that this data's become available.
DraymondGold wrote: Unfortunately BBRef doesn't do on/off per 48 minute (only per 100 possessions) or healthy filters, as you noted! I used one of the standard sources for accurate plus minus data instead (pbpstats.com). You can find data for the players by going to pbpstats.com -> on/off -> Wowy (by which they mean on/off, not WOWY the game-level plus minus) -> then choosing the team/player to be on/off -> Get team stats. This just gives us a player's total "On" and "Off" and their minutes, and from there we can get the On/off by using the formula:
On/off per 48 minutes = On per 48 - Off Per 48 = [(total ON points)*(48 minute)/(total ON minute)] - [(total OFF points)*(48 minute)/(total OFF minute)].
Pbpstats doesn't go before 2001 for some reason, so I had to use nba.com for the total plus minus data before that year. It's a bit unnecessarily intensive, but I wasn't sure of an easier way to get a players' total On and Off.
Back to Curry, pbpstats actually has a filter to only include games where someone played when Calculating the Off (on that same Wowy page: Add player Filter -> Exactly 1 of Stephen Curry Played in Game). I used the same filter to get the other players' "only games played" value. To get the extra Healthy Curry filter, I filtered out the games he played through injury in 2016. Since everyone agreed he was playing injured at the time, and quotes have confirmed later on he was playing through injury, that seemed fair. I had to do this manually: since he only played 1 fully healthy game before injury in 2016 playoffs, I just used that game's On and Off for the 2016 run. It's unfortunately a pretty small sample size for a single playoff run (how good would that team have been with a fully healthy Curry??), but that still gives us nearly 3000 on-minutes and over 800 off minutes in the full 5-year healthy run. Plus if anyone complains, adding either of the neighboring samples (2014 playoffs or 2021 play-ins) would actually improve the playoff on/off.
Sorry for the long explanation, but hopefully that covers everything!
I was trying to calculate 15-19 Curry only games played myself to check this, and got a different value, more than likely because I messed it up. Could you correct my math?
With that said, it sucks to see OhayoKD and AEnigma attempting to discredit this work. I'm pretty new here so I don't want to tread on toes but it seems like a very blatant attempt to discredit stats that don't align with their agenda. That's pretty lame.
Hey NoParticular, glad you’re checking my work! It’s always good to double check people’s math, and I definitely could have made an occasional typo or something that produced an error (like accidentally using the 15-19 sample over Curry’s better 17-23 sample in my main list).
In this case, your math looks exactly right, but I think there’s one thing. It looks like you’re using the Points column, but I think you should be using the P/m (plus minus) column. Points is the total points that your team scored, but the plus minus is the total point differential (I.e. total points your team scored - total points opposing team scored). The raw plus/minus (on) is usually the point differential between the two teams (not the total points of your own team ) while you’re on, while the on/off is the change in the point differential when a player’s on vs off.
The column labels aren’t the clearest, but once you’re using the right column, your math looks good.
So e.g. in your formula’s Curry On, you’d want 725 p/m rather than 8152 Points, etc.
And yeah sometimes you get less productive discourse here. It’s unfortunate — I tried quite a few times to make it work with this particular poster (definitely over 5 requests across multiple conversations), but for some reason they just prefer to strawman and be passive aggressive (e.g. asserting that I only want to do this for Curry and not others, despite my explicitly stating otherwise). Me personally, I find it best to just ignore less productive discourse. But I don’t mean to turn you off from them if you’re new round here! There are other posters who seem to be able to have productive conversations, so maybe you’ll have better luck.
Anyway, let me know if there’s any other math mistakes you catch! Re: making health corrections for others, from memory I think Giannis and Chris Paul may have gotten injured and kept playing / returned too early in the playoffs, so if I could get a list of the games to filter out for them, that would be interesting to check. How much do these games playing through injury pull down their averages? Perhaps Kawhi too? I think during his peak he usually just did not play at all when he was injured (as opposed to playing through injury), though I could be forgetting some games.
NoParticular wrote:With that said, it sucks to see OhayoKD and AEnigma attempting to discredit this work. I'm pretty new here so I don't want to tread on toes but it seems like a very blatant attempt to discredit stats that don't align with their agenda. That's pretty lame.
A fascinatingly specific accusation for a supposedly new user with all of seventeen posts. Care to break that one down for me, champ? Because I would hate to come across to wide-eyed entrants such as yourself as having this very evil anti-health agenda, to an extent that you just oh so bravely had to speak out against said overwhelmingly obvious agenda.
Absent any substantive criticisms (waiting with baited breath!), I think it is pretty lame for a “throwaway” to attempt to discredit anyone who would question the blatant erasure of a narratively inconvenient sample from an average.
To complement my analysis of 5-year On/off Runs, here' a quick survey of 5-year Relative Plus Minus (On) runs!
Note: this list is far from complete. Moreso than On/off, I'd expect raw plus minus to be noisy -- there are likely plenty of random starters/role players who happened to share a lot of minutes with all time players on all-time teams who would be quite high on this list. To filter for this (and for ease of searching), here I've just compiled the best runs by players who have received an MVP or FMVP. This set of players has some flaws too (e.g. I'd rather Draymond > Iguodala as a 3rd 2010s Warriors player, or Ben Wallace > Chauncey Billups as a 2000s Pistons player), but it's at least a self-consistent list that's fairly straightforward to check.
Also, even moreso than on/off, a player's On rating can vary a great deal given differing opponents / strength of schedule. 5-year playoff runs are not enough to assume an equal strength of schedule (unlike the regular season, where players face a diverse enough cast of opponents that strength of schedule corrections are minimal/negligible when looking at raw plus minus). As a result, I've corrected their Plus Minus for opponent faced (using opponent SRS, weighted by minutes played against each opponents since this is Plus Minus per 48 minutes). This is only an approximate correction: a true correction would require going to APM/RAPM to account for the actual rotations faced, not just the average quality of the opposing team. Still, relative On gives us a bit more accurate of a rating than raw On.
For context, here are some alternate time frames / players:
Spoiler:
Some random other players' best runs: - 14-18 Chris Paul +10.51 - 14-18 Draymond +14.98 - 03-07 Manu +14.32 - 09-13 Jason Kidd +8.51 - 97-01 John Stockton +7.08 - 11-16 Paul George +5.95
Some other time frames for the MVPs/FMVPs: Note: range is from slight disagreements in hand tracking by Djoker/Dipper13 vs Thinking Basketball/Squared2020. - 86-90 Jordan +6.94 – 7.2 - 87-91 Jordan +9.65 – 9.84 - 88-92 Jordan +10.10 – 10.35 - 89-92 Jordan +11.60 – 11.81 (would rank 10th on above list) - 90-95 Jordan +11.11 – 11.2 - 91-96 Jordan +12.53 – 12.63 (would rank 6th) - 92-97 Jordan +12.14 – 12.24 - 93-98 Jordan +12.76 (ranks 5th) For those who consider 1995 Jordan out of shape and want a healthy/in-shape filter: - 90-96 Jordan (no 95) +13.16 – 13.24 - 91-97 Jordan (no 95) +13.74 – 13.83 (would rank 3rd) - 92-98 Jordan (no 95) +13.24 – 13.33
Quick thoughts: As expected, some of the stars on dominant dynasties are toward the top. The Warriors look best: Curry always looks GOAT level in plus minus data, and Durant isn't far behind in On rating (although he lags behind in on/off).
After the Warriors, old Robinson, Jordan, and the 2010s Spurs (Ducan/Kawhi) look great. Jordan is no surprise -- the Bulls were a GOAT-level dynasty. Old Robinson continues to look great in the playoffs when he had a better fitting cast around him. One wonders how well he could have looked in the playoffs when he was younger, if he had a better fitting cast to help cover his offensive weaknesses as a lone star. Given the 2010s Spurs dominance of their stars and depth, it's a wonder they didn't win more rings. They were one shot away in 2013, and a two-peat from them would be more fitting given their statistical dominance. Otherwise, they were upset in 2012 by the Thunder (won the first 2 but lost the last 4 games of the series to a team with 3 fewer wins and 0.73 worse SRS), lost in the first round of 2015 (lost game 7 by 2 points to a team that was barely better than them in the RS), and were upset in 2016 by the Thunder. Was this bad luck, a lack of Spurs resilience, or were the Thunder just a bad matchup for the Spurs? Regardless, their stars' playoff relative Plus Minus looks great for this 5-year run.
After that group, LeBron, Shaq, and (a surprise appearance from) Embiid come next.
Otherwise, Garnett looks better when he's older with the Celtics, Kobe looks better with Shaq, and Harden looks better with Westbrook/Durant. The first two make sense: the data is filtering for when the players had better teams. Harden, for whatever reason, seems to look better in raw plus minus data (e.g. playoff on / on-off) before the heliocentric box-score explosion. I'm not quite sure what the best explanation is. Perhaps the Harden' Rockets dominance was too short-lived in 2018 and the drop off in 2017/2019 was too much to make up for the sustained dominance of the Durant Thunder? Perhaps the opponent adjustment underrates the 2018 Warriors, who were coasting in the regular season? Perhaps the Thunder's style of play was more scalable when all were on the court, while the Rockets was less scalable and focused more on splitting Chris Paul/Harden's rotations, at the cost of their plus minus performance?