Voting will close sometime after 12:00PM EST on Friday, July 11. I have no issue extending the time to vote so long as discussion is strong — and for this thread that seems reasonably likely — but please try to vote within the first three days.
Official ballots must include 3 different player peaks (name + year) and at least one line of reasoning for each of them. Votes which fail to do this will not be counted. Keep in mind that the expectation is to generally try to offer more than the bare minimum: reasoning such as “GOAT player in his GOAT season,” absent any other engagement or commentary in the thread, contributes exceedingly little to the primary purpose of the project, which is the thought and discussion behind the comparisons rather than the vote results themselves.
Example #1 1. 2004 Andrei Kirilenko: Explanation 2. 2006 Shawn Marion: Explanation 3. 2004 Metta Artest: Explanation
You may also list alternate peak seasons from your three players. This is an optional step included to give clearer representation in the event that consensus is split on the choice of peak seasons. Do not list every good season a player has; the intent of this feature is to help settle disputes between specific seasons contending for selection as that player’s peak.
Example #2 1. 2004 Andrei Kirilenko: Explanation 2. 2006 Shawn Marion (> 2003 > 2007 > 2005): Explanation 3. 2004 Metta Artest (> 2003 > 2006): Explanation
Ballots need not follow this exact format, but I request you format your ballot in such a way that a) it is obvious that post is your voting post, and b) a quick glance is sufficient for me to tally your vote. If you decide to change your vote before the votes are tallied, please edit that same voting post rather than posting a new ballot (although you are encouraged to make separate posts about what changes you made and why).
Each thread will last at least 72 hours before I begin tallying. If there is no simple majority, then the winning player and that player’s winning season will be determined with a Condorcet tally.
Below is the list of approved voters for this thread:
Spoiler:
AEnigma wrote:
benson13 wrote:
BusywithBball wrote:
capfan33 wrote:
ceoofkobefans wrote:
Chip wrote:
clearlynotjesse wrote:
cupcakesnake wrote:
DCasey91 wrote:
Djoker wrote:
Doctor MJ wrote:
DQuinn1575 wrote:
DraymondGold wrote:
Elpolo_14 wrote:
emn_010 wrote:
EmpireFalls wrote:
f4p wrote:
falcolombardi wrote:
homecourtloss wrote:
IlikeSHAIguys wrote:
jalengreen wrote:
jiffzzz wrote:
Junoobi wrote:
Lebronnygoat wrote:
LeoClark wrote:
lessthanjake wrote:
letskissbro wrote:
McBubbles wrote:
metta-tonne wrote:
mdonnelly1989 wrote:
Mogspan wrote:
OhayoKD wrote:
Ol Roy wrote:
Ollie Coraline wrote:
One_and_Done wrote:
Paulluxx9000 wrote:
penbeast0 wrote:
Reardonwd wrote:
ReggiesKnicks wrote:
rk2023 wrote:
Samurai wrote:
ScrantonBulls wrote:
Stan wrote:
Top10alltime wrote:
trelos6 wrote:
trevon2x wrote:
trex_8063 wrote:
tsherkin wrote:
VanWest82 wrote:
Verticality wrote:
Anyone may post on-topic thoughts in the thread, but only approved voters will have their ballots counted. Requests to join the project can be made on the general discussion thread; however, unless you were included on that initial notification list or otherwise have an established history voting in forum projects, you will need to wait until the next thread to be given consideration as an approved voter. Finally, meta commentary or questions should be restricted to the above-linked general thread to keep voting threads focused on discussing peaks.
NBA Champion, Final MVP, NBA MVP, All defensive first team, scoring champion. Career high in TS% 61.4, 2nd highest PER of career, BPM 11 elite, led NBA in WS, and WS/48. In 91 playoffs lead all players in scoring, elite efficiency, dominated both ends, PER equal to regular season (RARE), WS led NBA post season.
Player #2: Shaq 2000-2001
In 2000–2001, Shaquille O’Neal was the most physically overwhelming force in the league, averaging 28.7 points, 12.7 rebounds, and 2.8 blocks on 57% shooting while anchoring a Lakers team that coasted through the regular season before detonating in the playoffs. He controlled the paint on both ends with a level of mass, coordination, and reactivity no other player could match. Opponents had no answer for his deep seals, spin baseline dunks, or second-jump tip slams that made seven-footers look unprepared for contact. Despite dealing with toe injuries and conditioning criticism, his presence alone dictated entire defensive gameplans. In the postseason, he raised his game further—30.4 points, 15.4 rebounds, 2.4 assists, 2.4 blocks per game—dismantling Sacramento, sweeping San Antonio, and outmuscling Dikembe Mutombo in the Finals without breaking rhythm. He was not just dominant; he was unmanageable. The Lakers went 15–1 in the playoffs, and no player was more responsible for that than Shaq. That season wasn’t his statistical peak—but in terms of fear, impact, and playoff violence, it might’ve been the clearest picture of his unsolvable prime.
Player #3: Lebron 2012 - 2013
NBA Champion, Finals MVP, League MVP, All defensive first team, Top .640 TS% career best!!, best PER 31.6, led NBA in Win shares, best VORP, .603% in playoffs. Clearly / Comfortably Lebrons best defensive season. (Lebrons 2016 playoffs have a run, but I prefer Lebrons defensive 2012-2013.
Gone back and forth over which version of lebron i prefer. 2009 is his defense peak and has the raw absurd production and 2 way play and had great offense in postseason despite a less polished skillset, 2013 is the middle point where his offense and defense where both close to their best and 2018 is probably my goat offense player overall but is no longer as strong of a 2 way player while still being a plus on that end
2016 is a bit of a compromise as he ramped up his defense playmaking and effort for the playoff run while also being at his offensive prime amd leading a monster offense, some streaky shooting along the way but in the postseason the bad mainly came in a low leverage 4-0 win over pistons
That version of lebron could simulataneously lift a defense to a degree few non centers ever have (2009 and 2013 lebron funnily enough are candidates too) functioning as a true rim protector at the '3' which is such a cheat code for team construction purposes
On the offense end it was not his true peak scoring + passing run (partly cause his jumper has been better other years like 2018 or 2014 which may be partly shooting variance) but the overall production and offensive lift to absurd team heights makes it one of lebron best offense years too
2- jordan 1990 (1991>1989>1988) Most voluminous scoring volume ever in legitimately stront efficiency, plus defense, lots of solid playmaking of his scoring threat with absurdly low turnovers, still the apex of the scoring first archetype
Combine it with what i consider borderline all D guard defense and low turnovers and he just adds too much firepower while having better defense than other all time guards (curry, magic, nash, etc)
3- hakeem 1993 (1994)
This was a rough pick betweem hakeem and kareem but i have came to feel that while not the scorer or passer kareem was, hakeem athletic advantages not only made him a superior defensive player, but may help him bridge the gap in a more modern game too
His ability to dabble into 3 point shooting, face up attacks and ball handling combined with his generational athletism would potentially make him one of the more dynamic offensive weapons today able to play the hyper athletic lob/rolling threat job as well as taking defenders both in face up (think giannis lite) or post up
The defense is obviously his main card where he probably beats every 3 point era center in impact (russel time machine'd forward to develop in the modern era may be the only one with s good enough athletism/size and lenght/IQ combo to be better, wenbayama at full potential the only other center i can see beating peak hakeem on D)
HM since i am sure it wont be long before he gets nominated
4- kareem 1977 (1974) People usually think of him as more of a "longevity guy" yet at his best he was the league best scorer and also close to its best defender which is somethingh i think only he and wilt have approached
Outlier efficiency scoring, halfcourt monster, good passing, rebounding amd rim protection
One of my few issues with him would be some of the limits of running a offense through a post up center that even players like jokic who are muvh stronger passers have suffered with in the modern game where teams know how to play rough in the post and passing lanes to prevent centers from getting to their spots and exploit their relative dependancy on their guards (ironically somethingh he suffered with himself at times like the 77 playoffs against blazers who harrased lakers weaker ballhandlers and made it hard for the ball to get to kareem in good spots, he just scored regardless
The game has changed to give more weight to offensive engines over two way bigs
There is a tricky thingh here because while is true jordan vs average guard or average all star guard is probably a bigger gap than kareem/hakeem vs average center or average all star center
that is probably less true in the modern game tho where scoring/passing guards run the league to a fair degree
1.LEBRON 2013 ( 2009 > 2016 >= 2010 = 2012 ) - The reason I take this season cause he the most complete ( a mix of late 00s physical and late 10s IQ court vision with additional defense ) Scoring he was elite everywhere on the Floor this year with him develop the post game and spacing due to being more offball, He's an elite roll man, an elite connecting passer, the best cutter in the league and shot 40% on catch - shoot 3s. His Stat were ( Inflation adjusted per 75 Possession ) : RS stat :30.3 PPG / 9.1 RPG / 8.2 APG with 2.9 Stocks and 3.4 TOV PS stat : 27.8 PPG / 8.9 RPG / 7.1 APG with 2.7 Stocks and 3.2 TOV
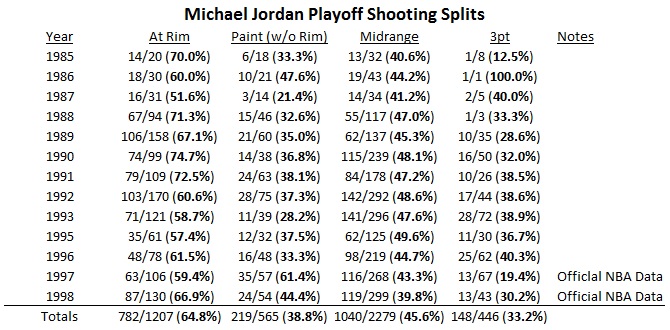
1. SCORING : • REGULAR SEASON ( ATP = ATTEMPT/GAme ) RIM(76%/ 7.12 ATP. ) PAINT(49.4% / 2.05 ATP - Low attempt) MIDRANGE(43.2%/ 5.30 ATP ) THREE(40.6%/ 3.34 ATP ) FT ( 75.3%/ 7.0 ATP ) average 30.3 PPG/IA75 ( Inflation adjusted per 75possession ) on +10.3 rts or +11.5 rTS% if we adjust for his own Putback ( not a waste of possession so it can be calculated as same shot attempt ).
• PLAYOFF - ( ATP = ATTEMPT/GAme ) RIM ( 69.1%/ 7.17 ATP. ) PAINT ( 34.1% / 2.17 ATP. -Low attempt ) MIDRANGE ( 37.3% / 5.26 ATP. ) THREE ( 37.5% / 4.17 ATP ) FT ( 77.7% / 7.6 ATP ) was 27.8PPG/IA75 on +7.5 rts adj. ( against -3.9rDRTG opponet ) in playoff and if we calculate for own shot Putback his effectiveness go to +7.9 rTS% adj. " As We see Lebron scoring is less impressive than in the regular season which can be explained by the scheme and Personnel he face in This playoff as Ilyasova - Larry Sanders / Luodeg - Butler - Noah - Boozer / Paul.G - Hibbert - Stephenson / Kawhi - Duncan - Green - Manu - Boris - Splitter "
The Spurs were also all time great
Spoiler:
Sansterre has a great writeup of the 2013 team [url]https://forums.realgm.com/boards/viewtopic.php?f=64&t=2042247[/url], #21 on his top 100 list.
Consider that 2013 SPURS team was a +6.7 SRS team with these regular season minutes:
Duncan, 69 games, 30 mpg (a much stronger version of Duncan compared to 2014 at least in the regular season) Parker, 66 games, 32 mpg Manu, 60 games, 23 mpg Kawhi, 58 games, 31 mpg
58 games won, +6.7 SRS with this many missing games and so few minutes played relative to other teams’ best players’ minutes. 2013 was a 63+ win, 8+ SRS team in disguise ESPECIALLY in the PLAYOFFS - Spurs Playoff Offensive Rating: +4.58 (60th), Playoff Defensive Rating: -7.25 (26th) Playoff SRS: +13.07 (25th), Total SRS Increase through Playoffs: +4.11 (21st) Average Playoff Opponent Offense: +2.45 (45th), Average Playoff Opponent Defense: -1.78 (55th) Round 1: Los Angeles Lakers (+1.5), won 4-0, by +18.7 points per game (+20.2 SRS eq) Round 2: Golden State Warriors (+4.1), won 4-2, by +3.8 points per game (+7.9 SRS eq) Round 3: Memphis Grizzlies (+8.3), won 4-0, by +11.0 points per game (+19.3 SRS eq) Round 4: Miami Heat (+9.2), lost 3-4, by +0.7 points per game (+9.9 SRS eq).
Also lebron Scoring also drop due to playing with another high usage player who didn't space the floor very well as Dwade injured his left knee making him hinder for the playoff. With Wade off the floor in the 2013 playoffs LeBron averaged 34.2 IA PTS/75 on +7.8 rTS% 9.3 REB/75 9.1 AST/75 2.0 STL/75 1.5 BLK/75 IT NOT AN OUTLIER due to low sample either cause for the 4 year span 2011-14 in the playoffs Lebron without Dwade on the floor AVR. 36.9 IA PTS/75 on 9.2 rTS% 8.6 REB/75 6.5 AST/75
Spoiler:
During the regular season: James/Wade paired really well together, +14.4 per 100 possessions on court, 114.4 ORtg, equivalent to about a +8 rORtg, would be the #1 offense in the league by over 3 points per 100 possessions
During the playoffs
2013 Heat ORtg with LeBron on court (960 minutes): 109.9 2013 Heat ORtg with LeBron and Wade on court (678 minutes): 105.0 2013 Heat ORtg with LeBron on, Wade off (282 minutes): 121.8
2013 Heat ORtg vs. Bucks with LeBron on court 115.1 2013 Heat ORtg vs. Bucks with LeBron On, Wade off: 116.8
2013 Heat ORtg vs. Bulls with LeBron on court: 110.1 2013 Heat ORtg vs. Bulls with LeBron on court, Wade off: 118.2
2013 Heat ORtg vs. Pacers with LeBron ON court: 110.6 2013 Heat ORtg vs. Pacers with LeBron on court, Wade off: 121.2
2013 Heat ORtg vs. Spurs with LeBron on court: 106.7 2013 Heat ORtg vs. Spurs with LeBron on court, Wade off: 131.3
2. PLAYMAKING AND OFFENSE IN GENERAL Lebron most important aspect is playmaking and being able to involve + create chance for his teammate. He one of the best Transition initiator all time due to his speed and size to travel to the other side of the court and have all time Court vision to decide if he wanna score himself or involve teammates who run transition with him.he make create read of the double when he got trap in PNR or when He on the post he able to deliver quick and accurate pass enough to capitalize on advantage create by his Gravity. when the defense decide to shut him off scoring wise he still create play for other. His have great tempo control at half court and able to manipulate the defense to a high level with his pace control on the ball. Off the ball he have great cutting read / elite screen setter due to size and his Ghost screen able to distract the defense cause of his thread as a roll man. in my TRACKING of bron in the final against the spurs ( 4 Game tracking ) Lebron average 20+ Creation per game while taking out defender 69+ time per game on avg.
Spoiler:
-RESUME of LEBRON 2013 final Game 1 Total Possession of play when lebron was on the floor on offense and defense – 78 Total Possession of play lebron have action both on/off ball on offense– 68 Playmaking -DTOs ( Defender take out ) - 70 -EDTOs ( Extra defender taken out ) - 35 - ADAs ( Additional Defenders Affected ) - 9 -Double - 14 -Triple - 3 -Création - 19 ~ R’Creation ( Rim ) - 2 - P’Creation ( Prerimeter ) - 17 -SC ( Screen ) - 9 - EPDL( Elite pass delivery ) - 11 - RPDL ( Regular pass delivery ) - 14 - BRDL ( Bad pass delivery ) - 3
- RESUME Game 7 lebron 2013 offensively Total Possession when bron was in the floor – 86 Total Possession of play lebron have action both on/off ball – 67 Total Possession of play lebron didn’t affect or didn’t have the opportunity to affect – 19 Playmaking -DTOs - 64 -EDTOs – 30 - ADAs – 15 -Double - 8 -Triple - 4 -Création - 21 ~ R’Creation ( Rim ) – 2 - P’Creation ( Prerimeter ) -19 -SC ( Screen ) - 9 - EPDL( Elite pass delivery ) - 7 - RPDL ( Regular pass delivery ) - 14 - BRDL ( Bad pass delivery ) - 3
- RESUME Game 6 lebron 2013 offensively Total Possession when bron was in the floor – 90 Total Possession of play lebron have action both on/off ball – 80 Playmaking -DTOs - 76 -EDTOs – 38 - ADAs – 25 -Double - 8 -Triple - 4 -Création - 21 ~ R’Creation ( Rim ) – 3 - P’Creation ( Prerimeter ) -18 -SC ( Screen ) - 11 - EPDL( Elite pass delivery ) - 10 - RPDL ( Regular pass delivery ) - 20 - BRDL ( Bad pass delivery ) – 2 - BB ( Bring ball up ) - 30
- RESUME GAME 5 FINAL ( I WILL EDIT AND POST WHEN I FIND THE FILES ).
AVERAGE 0.84 DTOs and 0.4 EDTOs per possession
In comparison to MJ who I think is in the GOAT offensive player as well as Lebron / Curry / Magic
Spoiler:
MJ when he became the primary Offensive initiator who the one deciding everything offensive pace because he loses Pippen due to injury: MJ 1989 Game 6 Jordan 13 assist game
RESUME: 69 DTOS, 34 EDTOS, total poss when MJ on floor - 86
MJ Average 0.80 DTO and 0.39 EDTO. Per possession
And when MJ play in system which he doesn't have the ball as much like lebron in Miami heat situation. To be fairest I pick highest assist game - 13 Assist.
[RESUME Game 2 MJ 1991 offensively Total Possession when MJ was in the floor – 61 Total Possession of play MJ have action both on/off ball – 58 Total Possession of play MJ didn’t affect or didn’t have the opportunity to affect – 3 Playmaking DTOs - 41 EDTOs – 17 ADAs – 4 Double - 8 Triple - 0 Création - 14 R’Creation ( Rim ) - 8 P’Creation ( Prerimeter ) - 6 SC ( Screen ) - 0 EPDL( Elite pass delivery ) - 7 RPDL ( Regular pass delivery ) - 13 BRDL ( Bad pass delivery ) – 3 BB ( Bring ball up ) - 22 MJ have 0.67 DTOs and 0.28 EDTOs Per Possession
Lebron creating seperation leave the room for his teammate to score. So even when his scoing get lower due to the defense loading on him he able to redirect it for his playmaking to be better. his impact as both floor riser and Ceilling get maximize cause he able to be elite both on/off ball
In PLAYOFFS on court Lebron when on the floor in the playoffs Lead a +9.1rORTG adj. against elite defensive team ( -3.9 rDRTG ) 1. Against the Buck ( -0.6 rDRTG ) lebron lead +10.9 rORTG adj. 2. Against Chicago ( -2.9 rDRTG ) lebron lead +8.9 rORTG adj. 3. Against Pacer ( -5.8 rDRTG ) lebron lead +11.6 rORTG adj. 4. Against Spurs ( -4.5 rDRTg ) lebron lead +6.4 rORTG adj.
REG SZN : Lebron 13 on/off net rating - when On the court lebron able to make the heats a +12.9 ( +11.9 filtered Low leverage possession ) and when he's put the heats are -3.5 ( -0.5 filtered Low leverage possession ) so in total lebron has an impact of +16.4 Nets Swing for the team ( +12.4 Net swing filtered )
On Offense his impact swing is +13.2 ( on +10.3 vs off -2.9 ) and For filtered swing is +8.4 ( on +9.4 vs off +0.7 )
When Lebron is on the floor his team Shoot more efficiently and are less TOv Prone -> 59.4 TS% ( +3.5 better than off ) / 14.2 TOV% ( -3.9 better than off ) / 25.1 OREB% ( -2.1 better than off ) And By filter possession it will look like 58.9TS% ( +1.8 better than off ) / 14.3TOV% ( -3.8 better than off ) / 24.9 Oreb% ( +1.4 better than off )
Spoiler:
Konr187 wrote:lebron 09-21 wowy 656-263 with lebron 0.714% win rate 37-73 without lebron 0.336% win rate net rating with lebron +6.49 (59 win pace level) net rating without lebron -5.50 (25 win pace level) +8.6 ortg difference -3.68 drtg difference +12 total swing.
3. DEFENSE Lebron was an Elite defense cause of his versatility on that aspect of the game. He was fast and mobile enough to be a great Prerimeter defender and Strong/Sturdy enough to guard wing or small Big at the interior (making him a great primary or secondary interior defender as a cleaner or deteriorating the rim ). HE have elite defensive signal especially off ball That Open his roaming ability to cover the court help his teammates to be more willing as aggressive help defender. His ability to guard many positive help him as A Switchable defender to counter mismatch hunting or to force the opposite team not to screen on Him. HE a good screen navigator to travel around the court and have great Recovery to be able to impact even in Transition defensively. Also good instinct as a help defender and he able to analyze when to fully committed to not be in disadvantageous situation
Lebron Impact on Defense when lebron is on he floor -> 103.3rDRTG ( -3.3 better ) / 52.4 D-TS% ( -1.3 better ) / 17.6 D-TOV% ( +1.9 Better ) And when filtered -> 103.6rDRTG ( -3.7 better ) / 52.6 D-TS%( -1.5 better ) / 17.8 D-TOV ( +1.5 better ) His impact both in total possession and filtered are almost as Impactful to the team Lebron Impact when missing his 2 option would be Lebron without Dwade -> +9.3 Net rating ( a swing of +17.1 if he was off court too ) Offense Swing of +15.7 ( on +9 vs off -6.7 ) and Defensive swing of -1.4 ( on -0.3 vs Off +1.1 ) Now with Filter out low possession -> +8.6 Net ( Swing of +11.2 ) / Offense swing +9.6 ( On 8.1 vs Off -1.5 ) / Defensive Swing -1.6 ( on -0.5 vs Off +1.1 )
Lebron can is an ALL TIME playmaker and ALL TIME scorer making him GOAT lvl Offense ( He is TOP 1-2 IMO ). He also has SubGoat-GOAT Wing lvl defense:
letskissbro wrote:Whenever the topic of best perimeter or non-big defender comes up the first names mentioned are usually Scottie Pippen, Ron Artest, AK47, and… Kawhi Leonard. I’m just wondering why Kawhi’s name continues to come up over LeBron when—besides one season—there’s very little evidence to support that he’s up there with the other guys.
Even those who haven’t fallen prey to social media narratives and are willing to entertain LeBron over Kawhi on D do so reluctantly with a heavy emphasis on longevity, and typically with the qualifier “when he’s trying.” LeBron is just a better, more impactful defender, over a larger sample size than Kawhi, full stop. No need for qualifiers.
To show this I’ll turn to to DRAPM. Here are the top perimeter defenders by PS DRAPM from 1997-2019.
Among qualifying players (2000+ MP): 1. Manu Ginobili (3.52) 2. LeBron James (2.28) 3. Kawhi Leonard ( 2.09) 4. Tony Allen (2.09) 5. Josh Howard (2.00) 6. Shawn Marion (1.84) 7. Paul George (1.72) 8. Jason Kidd (1.70) 9. Tayshaun Prince (1.67) 10. Rajon Rondo (1.64) 11. Bruce Bowen (1.53) 12. Danny Green (1.50) 13. Mike Conley (1.40) 14. Dwyane Wade (1.37) 15. Luol Deng (1.25) 16. Metta World Peace (1.23)
Besides Ginobili, who appears to be a clear case of collinearity due to playing heavy minutes with Duncan, LeBron leads the competition. And he does so with 10049 minutes played, far more than anyone else on the list. Kawhi only has 3806 minutes. This is important because more minutes typically suppresses career averages since it’s pulling from pre-prime and post-prime samples. What about the regular season? LeBron’s often criticized for not giving full effort year-round and coasting but is this actually true or just the product of lazy analysis?
At first glance, RS DRAPM appears to support the LeCoast narrative. However, there's something very important to consider here. One issue with comparing non-big defenders, particularly small forwards, through a statistical lens is that some of them spend significant time at the 4 spot, which hurts them since they’re usually playing with less rim protection as the second biggest defender on the court. The ability to place your SF at the 4 can be a luxury offensively because it allows for better spaced lineups. But it often comes at a cost to your defense that I don't believe should be factored when trying to decide the best non-big defender(s), since you're essentially assigning them responsibilities that are typically reserved for a big man.
I did a rough adjustment of scaled Goldstein DRAPM which attempts to account for discrepancies in rim protection and find the average quality of a player’s prime defensive season on the perimeter. It’s a simple calculation and the methodology isn’t flawless, but it passes my smell test a lot better than the raw numbers. To calculate it I simply took the years which I interpreted to be the player’s defensive prime and used bballref’s position estimates to weigh DRAPM proportionately to how much time they actually spent on the perimeter. If they exceeded 40% of their minutes played at PF/C I scrapped the season altogether, since it made for some big outliers.
I included some notable guard defenders to show that—besides standouts like Tony Allen and Ron Harper (limited sample)—there is clearer separation between small forwards and guards with this model as well.
Shane Battier: 2.22 LeBron James: 2.21 Andrei Kirilenko: 1.99 Bruce Bowen: 1.99 Metta World Peace: 1.95 Ron Harper: 1.95* Tony Allen: 1.88 Shawn Marion: 1.87 Kawhi Leonard: 1.72 Thabo Sefolosha: 1.64 Andre Iguodala: 1.50 Michael Jordan: 1.32* Paul George: 1.30 Chris Paul: 1.22 Kyle Lowry: 1.16 Danny Green: 1.15 Jason Kidd: 1.13
4. OVERALL IMPACT Regular Season Record: 66-16, Regular Season SRS: +7.03 (46th), Earned the 1 Seed Regular Season Offensive Rating: +6.4 (13th), Regular Season Defensive Rating: -2.2 (70th)
PG: Mario Chalmers, +0.4 / -1.6 SG: Ray Allen, +0.3 / +0.7 SF: Dwyane Wade, +4.4 / +3.1 PF: LeBron James, +11.7 / +10.4 C: Chris Bosh, +1.3 / +1.9
Heliocentrism: 52.7% (5th of 84 teams) - LeBron Wingmen: 31.4% (71st) - Wade & Bosh Depth: 15.9% (68th)
Playoff Offensive Rating: +8.17 (18th), Playoff Defensive Rating: -2.32 (81st) Playoff SRS: +10.62 (50th), Total SRS Increase through Playoffs: +2.38 (52nd) Average Playoff Opponent Offense: -0.68 (99th), Average Playoff Opponent Defense: -3.89 (10th)
Lebron in 2013 have record with Dwade of 7-1 ( 0.825 w ) 68 win Pace Lebron in 2013 have record without Bosh of 5-0 ( 1.00 w ) Lebron in Miami record without Dwyane Wade in the span of 4 years ( 2011-2014 ) have a record of 41-14 ( 0.74545.. W ) or 61.127... win Pace adjusted And without Bosh in same time span he's 12-4 ( 0.75 w ) or 61.5 win pace adjusted
- LEBRON WOWY 2013 ( 6 GAME SAMPLE ) OFFENSE : +3.2 rORTG DEFENSE : -2.4 rDRTG SWING : +5.6 POINT Diff. - LEBRON WOWY 2011-2014 ALL MIAMI YEAR ( 18 GAME SAMPLE ) OFFENSE : +8.5 rORTG DEFENSE : -3.1 rDRTG SWING : +11.6 POINT Diff. - Switching from WOWY, to lineup-ratings, the Heat were +11.04 with Lebron/Wade lineups, +2.7 with with Wade, no Lebron lineups, 10.87 with Lebron/Bosh lineups, -1.19 with Bosh, no Lebron lineups, +10.28 with the big-three, and -4.48 with the big-three minus Lebron. The heat were also +2.77 in lineups with Lebron and without Wade or bosh. Overall, Lebron lineups scored at +9.62 while Lebron-less lineups scored at +0.75
For my criteria to evaluate player I think Offensive Trancent ( ANY position ) = Defense Trancent ( Center /Big wing ) Offensive Trancent ( ANY position ) >= Defense Trancent ( Big wing ) Offensive Trancent ( ANY position ) > Defense Trancent ( Small wing ) Offensive Trancent ( ANY Position ) >> Defense Trancent ( Guard ) That why I chose Lebron as Top 1 Peak : Lebron offensive transcent + Defense Trancent (BigWing) : All time scorer / all time faciliter and playmaker / Arguable Goat tier wing defender
So IMO. He’s best ever. I pick 2013 because even tho his role on offense diminué due to play with another high usage rate Player that hinder his capacity he still able to fit in and production All time Quality for the team. And he all time wing defender
2. KAREEM 1977 ( 1974 > 1972 = 1971 >= 1980 )
KAREEM WAS ELITE both end of the floor with his offensive engine by his rim pressure with the skyhook and his great Interior defense presence was a really important aspect for that era "especially cause their no 3pt line yet and not many players were shooting from a far distance. This make him have one of the best floor rising season in NBA history making a lack luster Lakers team to a 53 win team with Top 5 ORTG (101.4 / +1.9 rORTg ) / Top 10 DRTG ( 98.9 / -0.6 rDRTG ) / Top 5 both SRS and Net rating ( 2.64 SRS / 2.60 rating ). 1. SCORING Kareem is an all time interior scorer ( might be GOAT tier rim touch )and Top 3 all time as overall scorer in my estimation . He have elite post movement with his slimmer build compare to big Chucky Center make him more agile+quick couple with his upper body movement make him really hard to guard 1-1 near the post/rim area and have better position control and awareness that most to capitalize on his attribute. Also his most known Skyhook which get release from a full hand + jump vertical height is nearly unstoppable to stop/scheme against. Even without Skyhook Kareem is elite enough to have great driving ability in both half court and transition situation. He also a decent FT shooter ( RS 70.1% / PS 72.5% )so team aren't willing to put him on the line as much as regular center in that era ( or even till the 2000+ era ) Kareem average ( IA/75 ) REG SZN : 28.2 PPG on +9.7 rTS PLAYOFF : 32.6 PPG on +13.5 rTS against -0.7rDRTG team
2. PLAYMAKING He have some great Gravity and can bring attention on him near the rim with his scoring ability but his other Skillsets as playmaker is abit more on the "OK" side. He have basic but useful passing delivery. He could be instinctively more bas eon scoring make him miss open teammates or cutting teammates but there time that he could read the situation fast enough to deliver the pass in a great opportunity. He have ok handle and ball initiator. His post playmaking to find offball teammates was good.
3. DEFENSE AND REBOUND Kareem is an all time rebounder by his elite positioning to gain advantage even tho sometimes he not as strong as other center or to use his height + Long arm to get the rebound. He have Great instinct to calculate the rebound trajectory Kareem AvR. - 14.2 RPG in the Regular Season - 16.7 RPG in Playoffs even tho he was up against an elite rebounder as Bill Walton Kareem defense constitue primary on Interior defense ( logic for era ) he have good discipline to intercept/contest shot near the paint. He was elite as a cleaner for his teammates mistake on Defense. Elite shot blocker and not easy to outpace near the rim. With his agility he able to pick on Wing or to be primary on Center. His offball defense as roamer and Help side defender Also help anchor the team defense. Also not to forget he have very active hand that able disturb opponent ball placement.
Kareem stat REG : 28.2 PPG / 14.2 RPG /3.8 APG with 4.7 Stock PLAYOFF 32.6PPG/ 16.7 RPG / 3.9 APG with 4.9 STOCK
He eventually loses against the Blazer it the playoff. The team that was going to win he championship later with peak Bill Walton ( someone who I rank really high on peak ) and Lakers team already mid losing keys player make it even harder for Kareem to win this series
I choose Kareem BCS he all time offensive player with all time Defensive big ability. Goat tier floor rising and carrying
3. TIM DUNCAN 2003 ( 2002 > 2004 = 1999 > 2001 ) Great regular and post season in which he shouldered a heavy load in both end of the floor with not much help on the offensive side. Impact metrics look great, especially in the playoffs. Defense is replicable in many different eras and can bring value in many situation while his offense was continuously resilient throughout the playoffs. . 1. Defense and rebound Duncan is an all time defensive motor for the team and his impact on defense even while playing PF ( not is real position and he give the position the D.rob ). Elite interior defender as his presence is enough to destabilize the offensive team. He can block shot / contest / Clean up for Prerimeter failure or even roam around to be able to help all the teammates if needed. With his size and really quick foot he can guard big or wing without much problem. Not much player ( except Shaq ) can penetrate Tim Duncan post defense regularly. He also a good PnR defender to keep up with the ball handler or the rill man. Not much exploitable in the prerimeter either. Have Great rebounding ability as he can Boxout with his frame and strength to overpower other player in the paint. Good balance and center of gravity to not be moved around easy additional with great defensive awareness make him a great rebounder PLAYOFF : 12.7 RPG REG SZN : 14.4 RPG Tim Duncan on/off is a +8.8 Net rating ( +16.3 Swing ) He lead +3.9 rORTG and -4.9 rDRTG on court Even without hi best interior defender on D.rob. Duncan able to lead -2.6 rDRTg ( 5.5 swing if Duncan was off too ) 2. SCORING He good in the overall scoring department. He have great post move and post scoring ability. An reliable mid range and elite rim touch. His FT shooting is decent enough to not be a weakness or can be good cause he force the opposite team to foul him making the defense less aggressive ( RS - 71.0% / PS- 67.7% ) . His scoring traits doesn't get limited by playoff scheme or person either ( with this year specificly ) REG SZN : 26.2 PPG on +4.2 rTS ( +5.8 rts adj to own shot Putback ) Playoff : 25.4 PPG on +6.2 rTS adj. ( Against -1.6 rDRTG ) 3. PLAYMAKER Duncan have Great read and good passing package to be impactful in this aspect of the game. Really good bounce pass and overhead pass. Great IQ to make or create separation for his teammates with his post gravity. All time screen setter with great screen timing. Elite roll man in the PNR or he can be be the ball handler who drive to the basket to pass out cause he get double by the defense too. TIM DUNCAN STAT REG SZN : 26.2 PPG / 14.4 RPG / 4.4 APG with 4.1 stocks and 3.4 TOV PLAYOFF : 25.4 PPG / 12.7 RPG /5.4 APG With 3.8 Stocks and 3.2 TOV In the playoffs On court he lead +3.4 rORTG adj. And 10.3 rDRTG adj.
NOMINATIONS - MICHAEL JORDAN 1991 or HAKEEM 1993-94 - his best and most complete year as a player Imo
Sorry to be boring with my selections. But it’s the top end of the board.
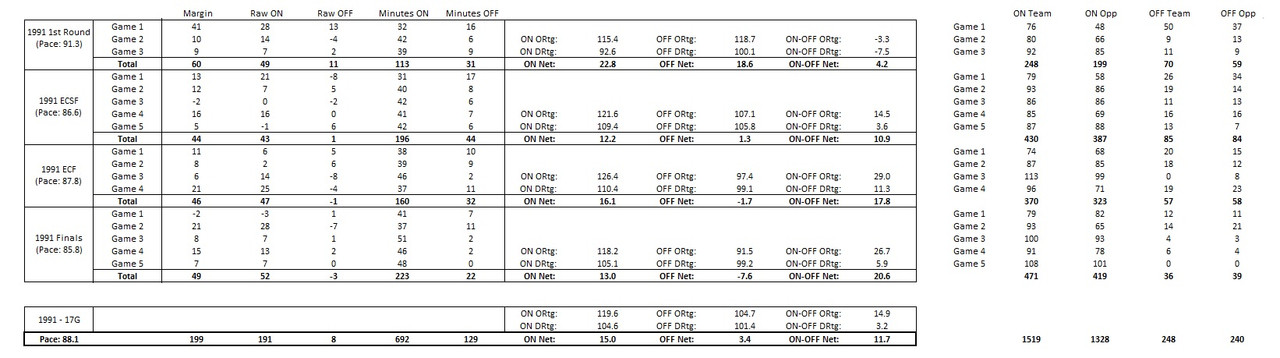
Michael Jordan (1991 > 1990 > 1989). Final year of his 3 year stretch, which IMO is the best 3 year stretch in NBA history. His 3 yr PS run included 34.1 pp75 on +7.3 rTS%. Specifically, In 1991 +6.52 OPIPM, +1.68 DPIPM. +8.21 PIPM. 24.12 Wins Added. RS: 32 pp75, +7.1 rTS%. Team rOrtg +6.7. Elite scoring, great efficiency. Elite team offense in both regular season and playoffs.
LeBron James (2013 > 2012 > 2009). RS: 28.1 pp75 on +10.5 rTS%. Team r Ortg of +6.5. Arguably the best playmaker in the league, and a top 5 passer. Playoffs were 25.5, +5. Career year from 3. Midrange was a lot better. He could now score from anywhere. +6.32 OPIPM, +1.46 DPIPM. +7.78 PIPM. 24.8 Wins Added. About as complete a player as we will ever see.
Shaquille O’Neal (2000 > 2001 > 2002). 28.6 pp75, +5.5 rTS%. Slight volume reduction in playoffs, and 2% TS drop. Team rOrtg +3.2. Regular season Lakers were the league leading defense. Shaq was a force protecting the rim. +5.13 OPIPM, +2.03 DPIPM. +7.16 PIPM. 25.74 Wins Added.
~The Statistical Case for Peak Jordan~ Who has the best peak according to the data? Across all the stats we have, there’s no one who’s 1st place across the board, beyond the range of uncertainty. Stats can be noisy (particularly plus minus and WOWY stats), and we’re missing more stats the further back we go. Changing the time span (e.g. emphasizing single years more, etc.) may also change the ranking slightly. This uncertainty makes for more interesting conversations! However, if the stats favor anyone, most concur that Jordan has the best peak of all time.
I’ve collected 30 stats that are available for Jordan across four major categories (plus minus stats, WOWY stats, box stats, and team stats), in both the regular session and the playoffs, with varying timespans. I’ve tended toward 3 year time spans to minimize noise of smaller 1-season samples, while capturing peak performance that significantly longer time spans miss. But I’ve expanded the sample size for the noisiest stats that require more data to be accurate (e.g. raw playoff on/off, WOWY) and included some supplemental samples for context when easily accessible.
Since this is a peaks project, every timespan must include the peak year, unless otherwise stated. For most players, there’s a consensus year: 1991 Jordan, 2000 Shaq, 1967 Wilt, 1977 Kareem. Since people debate whether LeBron was at his peak during his 1st Cleveland (2009), Miami (2012/2013), or 2nd Cleveland (2016) stint, I’ve included data from each of these stints separately. In multi-year timespans, I only require that the peak year be included; I do not require that we use the same 3-year and 5-year timespan each time, although that would also be a valid approach. There are multiple valid approaches for multi-year data, and others are welcome to try different timespans. These are 30 of the most standard stats used — basically everything I could find, so no cherrypicking metrics or anything. Below you’ll find Jordan’s all-time rank, and how it compares to other standard GOAT peak candidates. For the all-time rank, I’m only counting one span per player (e.g. if Jordan’s peak is listed below as being 3rd all time, this means that there are 2 players above him).
A. Plus-Minus Stats (and box estimates of plus-minus stats) Let’s start with the most accurate category of stats: plus minus stats, and composite stats that incorporate plus minus data. For some composite stats, early samples will be box-based estimates of the true composite version of the stat (#2, 3, 8, 9 below). These box estimates are made with the express intent of comparing to the true composite, so it’s as accurate a comparison as we can make. As we’ll see, Jordan’s available plus minus profile is strong enough that we shouldn’t expect his rank to change much if we had his true composite version instead of box estimates. Remember, plus minus stats are noisy, even in several year samples, so we wouldn’t expect any one peak to be ranked highest across the board.
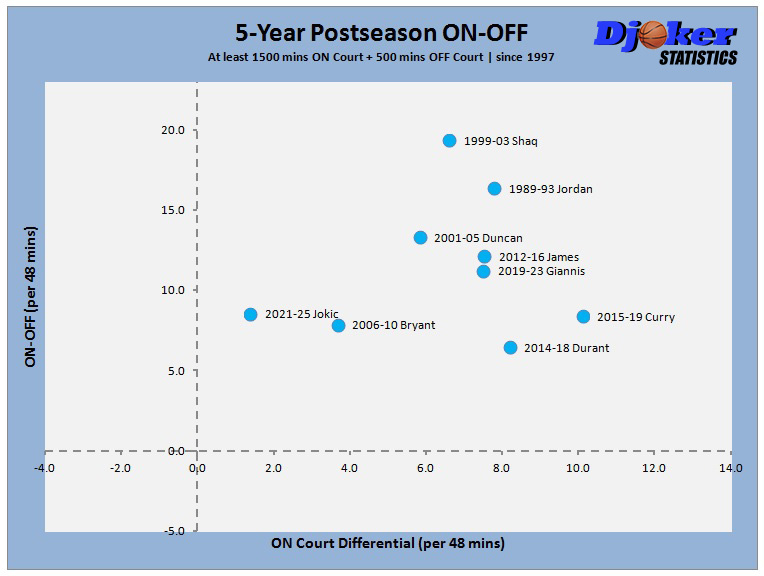
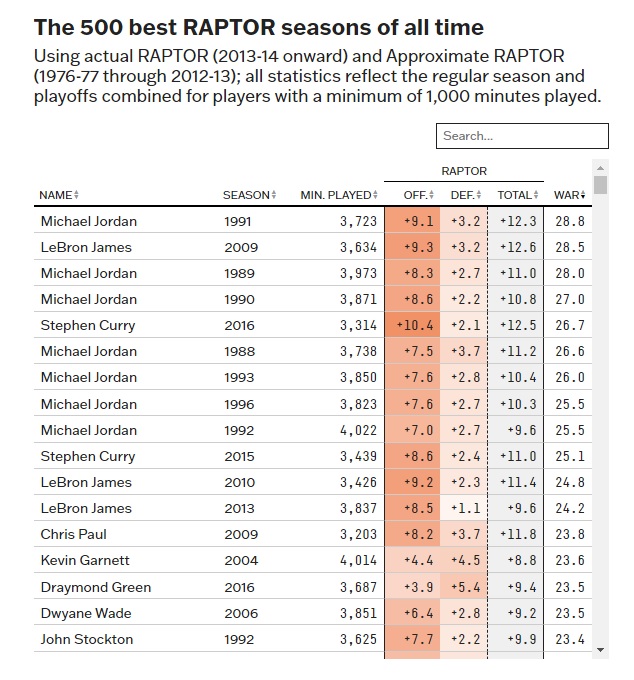
Ai. Postseason stats: 1. 3-Year Postseason Augmented Plus Minus (since 1997 + prime Jordan): 1st all time. Jordan > Duncan > 1st Cavs LeBron > 2nd Cavs LeBron > Shaq > Miami LeBron Note: Peak Jordan’s also 1st all time in at least 1-year and 5 year samples. 2. 3-Year Postseason PIPM (box estimate since 1974; plus minus data since 1997): 2nd all time. Kareem > Jordan > 1st Cavs LeBron > 2nd Cavs LeBron > Duncan ~ Shaq (98–00 above, 99–01 below) > Miami LeBron > Curry Note: Peak Jordan’s also 2nd all time in 1-year samples. He’s 1st all time in 5-year samples but we’re missing pre-74 Kareem. 3. 3-year Postseason RAPTOR (box estimate since 1977; plus minus data since 1997): 1st all time. Jordan > 1st Cavs LeBron > [healthy 2014–17 Curry] > 2nd Cavs LeBron > Miami LeBron > Curry > Duncan > Kareem (no pre-1977 data) > Shaq Note: Peak Jordan’s 3rd all time in 1-year samples behind 1st Cavs LeBron. He’s 1st all time in 5-year samples.
4. 3-year Postseason On/off (since 1997 + prime Jordan): 8th all time. Duncan > [Post-peak 02-04 Shaq] > [Early Peak 88-90 Jordan] > 1st Cavs LeBron > Peak Shaq > Peak Jordan > 2nd Cavs LeBron > Miami LeBron Note: On/off is very noisy in small samples, so rankings change with different filters. Early Peak Jordan (1988-1990) would be 5th all time, but this sample does not include the primary peak year (1991), so Peak Jordan’s listed at 8th all time from 1989-1991. 5. 5-year Postseason On/off (since 1997 + Jordan): 2nd all time. [Early Peak Jordan] > Shaq > Peak Jordan > 2nd Cavs LeBron > Duncan > 1st Cavs LeBron > Miami LeBron Note: Early Peak Jordan (1986-1990) would be 1st all time in 5-year samples, but this sample does not include the primary peak year (1991). Peak Jordan (1987-1991) is 2nd all time only behind Shaq in 5-year samples.
6. 3-year Postseason relative Plus Minus (among MVPs/FMVPs since 1997 + prime Jordan): 9th all time [prime Jordan] > 2nd Cavs LeBron > Shaq > Peak Jordan > Duncan > 1st Cavs LeBron > Miami LeBron Note: Prime Jordan (1996-1998) would be 1st all-time, but this sample does not include peak years. 7. 5-year Postseason relative Plus-minus (on) (among MVPs/FMVPs since 1997 + prime Jordan): 6th all time. [prime Jordan] > Peak Jordan > 2nd Cavs LeBron > Shaq > Miami LeBron > Duncan > 1st Cavs LeBron. Note: Prime Jordan (1993-1998) would be 5th all-time, but this sample does not include peak years.
Aii. Full Season and Regular Season stats: 8. Full Season 3-year PIPM (box estimate since 1974; plus minus data since 1997): 2nd all time. [88–90 Jordan] > 1st Cavs LeBron > 89–91 Jordan > [74-76 Kareem] > Duncan > (75-77) Kareem > Curry > Miami LeBron > Shaq > 2nd Cavs LeBron Note: Early Peak Jordan (1988-1990) would be 1st all time, but this sample does not include the primary peak year (1991), so Peak Jordan’s listed at 2nd all time from 1989-1991.
9. Regular Season 3-year RAPTOR (box estimate since 1977; plus minus data since 1997): 1st all time. Jordan > 1st Cavs LeBron > Curry > Miami LeBron > Tim Duncan > Shaq > Kareem (no pre-1977 data) > 2nd Cavs LeBron Note: Peak Jordan’s also 1st all time in 1-year samples (albeit in an early peak year in 1988; 1989 Jordan’s 4th and 1991 Jordan’s 6th behind Curry and 1st Cavs LeBron). Jordan’s also 1st all time in 5-year samples. 10. Regular Season 5-year On-off (since 1994 + Squared2020/Pollack earlier): 1st all time. Peak Jordan > [Curry >] 1st Cavs LeBron > 2nd Cavs LeBron > Miami LeBron > Shaq > Duncan Note: For Jordan, we have 209 randomly sampled games (51%), with the Bulls doing slightly worse in the available sample compared to the same years. We don’t have any 1989 games, so are unable to do 3-year regular season on-off for 1989-1991. In 1990–1992, Jordan would be 3rd all time just behind peak Curry and Jokic. In any multi-year RS peak sample (2-5-year spans), Jordan’s far above the next usual GOAT peak candidate (~25–50% above LeBron). Note: In 2–5 year Full Season (RS+PS) samples, peak Jordan is also on pace to be above any typical Goat Peak candidate with available data (LeBron, Shaq, Duncan, Curry, etc.), although I have not checked all available players.
B. Prime WOWY-based stats Bi. ‘Raw’ WOWY data (looking at team performance in games with a player and without a player playing in that game). WOWY data is too noisy to look at samples smaller than a prime in a systematic and consistent way according to the inventor of WOWY himself, so we look at full prime data for this section. 11. Raw 10-year prime WOWY (since 1955): 32nd all time. Curry > LeBron > Shaq > Duncan > Jordan > Wilt > Kareem 12. Raw 10-year prime multi-year (e.g. team-change) WOWY (out of standard Top 15 players): 4th all time. Curry > LeBron > Jordan > Shaq > Kareem > Wilt > Duncan Note: there's been some disagreement on the exact right way to calculate team-change WOWY, and whether to try to manually adjust for other players who also changed rosters. People are acerbic when I didn't adjust try to adjust for other players, then others became acerbic when I did. Feel free to disregard or manually do different treatments of team-change WOWY yourself if you'd like a different treatment.
Bii. ‘Adjusted’ WOWY data (adjusting for opponents/teammates; this adjustment is just like how you can adjust raw plus/minus to make an adjusted plus minus / RAPM) 13. 10-year prime WOWYR (since 1955): 4th all time. Jordan > LeBron > Shaq > Kareem > Wilt > Duncan 14. 10-year prime GPM (since 1955): 8th all time. Jordan > Duncan > Shaq > Kareem > LeBron > Wilt 15. Moonbeam’s Career RWOWY (since 1952): Top 10 (~6th) all time. Wilt >~ Shaq >~ Jordan >~ LeBron >~ Duncan >~ Curry >~ Kareem Note: Moonbeam suggested against using a single 5-year sample for comparison across eras (and indeed used percentiles instead of a WOWY score to emphasize this). Instead, he suggested either (i) using single samples for comparison within era (recalling high uncertainties in WOWY data; and indeed specifically noting that peak Jordan likely had collinearity that underrates his impact), or (ii) using general career arcs to compare players’ careers. He did not release the complete dataset of all percentiles to enable #ii, but one can estimate the percentiles based on his posted plots. Here I've looked at how many samples each player has above different percentile thresholds (see notes below for details). More work could be done to enable fair comparison in RWOWY across samples.
C. Box stats 16. 3-year Postseason Thinking Basketball BPM (since 1955): 1st all time. Jordan > 2nd Cavs LeBron > 1st Cavs LeBron > Miami LeBron > Kareem > Duncan > (healthy Curry) > Wilt > Shaq > Curry Note: Peak Jordan’s also 1st all time in 1-year and 5-year samples. 17. 3-year Regular Season Thinking Basketball BPM (since 1955): 1st all time. Jordan > 1st Cavs LeBron > Curry > Miami LeBron > Bucks Kareem = Wilt > Shaq > Duncan > 2nd Cavs LeBron > Lakers Kareem Note: Peak Jordan’s also 1st all time in 1-year and 5-year samples. 18. 3-year Postseason Basketball Reference BPM (since 1974): 1st all time. Jordan > 1st Cavs LeBron > 2nd Cavs LeBron > Miami LeBron > Kareem > Duncan > Shaq 19. 3-year Postseason WS/48 (since 1952): 1st all time. Jordan > Kareem > young Warriors Wilt > 1st Cavs LeBron > 2nd Cavs LeBron > Miami LeBron > Duncan > Shaq > peak 76ers Wilt
20. 3-year Regular Season Basketball Reference BPM (since 1974): 3rd all time. 1st Cavs LeBron > Jordan > Miami Lebron > Kareem > Shaq = 2nd Cavs Lebron > Duncan Note: Peak Jordan’s 2nd all time in 5-year RS BPM, above 1st Cavs LeBron. BPM is a per 100 possessions ‘rate stat.’ In volume, He’s 1st all time in 1 year VORP (early peak in 1988; he’d be 3rd all time in 1991), 1st all time in 3-year VORP (including 1991), and 1st all time in 5-year VORP.
21. 3-year Regular Season WS/48 (since 1974): 3rd all time. [early prime Kareem] > Jordan > 1st Cavs LeBron > Miami LeBron > Wilt > Shaq > Kareem > Duncan > 2nd Cavs LeBron. Note: In volume, he’s still 3rd all time in 3-year Win Shares, but now behind early prime Kareem and Wilt
D. Prime Team Stats: When all-time players have strong supporting casts, they should be able to lead all-time teams; conversely, all time teams require all-time talent, so one might use team performance as evidence for the value of an all-time player (if one can complement team stats with film analysis or player statistics, e.g. the ones above, to distinguish how much of the team success comes from the star player vs the supporting cast). Player impact tends to face diminishing returns on better teams: It’s more impressive for a player to bring all-time value surrounded by good talent an all-time team than to provide that same lift on a worse team.
As such, it’s informative to look at how good each team was during the player’s peak year. This context will let us appropriately reward players who peaked on better teams (since their impact metrics might be more limited by diminishing returns) and reward players who provide GOAT level ceiling raising (which would maximize title odds).
However, since players can’t control their supporting cast in a given year, I’ll also be providing each player’s best team performance during their full career in brackets, whenever a player had a better team performance in a non-peak year. Changing whether you’re comparing each player’s team during their peak year vs their best team performance over their career won’t significantly change the results for Jordan. Of course, team performance should not be the only form of analysis (indeed it’s not here), and team stats should probably have less weight than individual stats, but it can nonetheless provide useful insights.
Di. Overall (regular season + playoffs) team stats. 22. Overall SRS (since 1955): 2nd all time (prime), 4th all time (peak). Curry (peak/prime) > [Jordan (prime)] > [Bucks Kareem (prime)] > Jordan (peak) > [old Duncan (post-prime)] > [Shaq (late peak)] > Wilt (peak/prime) > 2nd Cavs LeBron (prime) > [Duncan (prime)] > Miami LeBron (prime) > Duncan (peak) > 1st Cavs LeBron (prime) > Shaq (peak) > Lakers Kareem (peak) Note: 3-year Overall SRS would also have prime Jordan’s Bulls just behind peak Curry’s Warriors. It peak Jordan’s Bulls would rise ahead of Kareem’s Bucks and every other player listed.
23. Overall Net Rating (since 1955): 1st all time (prime), 5th all time (peak) [Jordan (prime)] > Curry (peak/prime) > [Shaq (late peak)] > Jordan (peak) > [Bucks Kareem (prime)] > [Duncan (post-prime)] > 2nd Cavs LeBron > [Duncan (prime)] > [Lakers Wilt (prime)] > Miami LeBron > 76ers Wilt (peak) > Duncan (peak) > Shaq (peak) > Kareem (peak)
27. Playoff relative Net Rating (since 1955): 3rd all time (prime), 4th all time (peak). [Shaq (late peak)] > Curry (peak/prime) > [Jordan (prime)] > Jordan (peak) > 2nd Cavs LeBron (prime) > [old Duncan (post-prime)] > [Bucks Kareem (prime)] > 1st Cavs LeBron > Miami LeBron (prime) > [Duncan (prime)] > Duncan (peak) >= Wilt (peak) > Kareem (peak) where is Shaq Note: 3-year Playoff relative Net Rating would have prime Jordan’s Bulls 1st all time, and peak Jordan’s Bulls just behind peak Curry’s Warriors and ahead of every other player listed.
28. Regular Season Net Rating (since 1947): 1st all time (prime), 7th all time (late peak), 18th all time (peak). [Jordan (prime)] > Curry (peak/prime) > [old Duncan (post-prime)] > [Jordan (late peak)] > [Bucks Kareem (prime)] > [Lakers Wilt (prime)] > 1st Cavs LeBron > Jordan (peak) > [Duncan (prime)] > Shaq (peak/prime) > Duncan (peak) > Miami LeBron > 76ers Wilt (peak) > Kareem (peak) > 2nd Cavs LeBron
29. Playoff common-opponent Net Rating (since 1984): 1st all time (prime), 4th all time (peak). [Jordan (prime)] > [Shaq (late peak)] > Curry (peak/prime) > Jordan (peak) > [old Duncan (post-prime)] > Miami LeBron (prime) > 2nd Cavs LeBron (prime) > [old Kareem (post-prime)] > 1st Cavs LeBron > [Duncan (prime)] > Duncan (peak) > Shaq (peak)
31. Regular Season Record (since 1947): 2nd all time (Prime). 7th all time (late peak). 54th (peak). Curry (peak/prime) > [Jordan (prime)] > [Wilt (prime)] > Wilt (peak) > [old Duncan (post-prime)] = [Jordan (late peak)] = Shaq (peak) > [young Kareem (prime)] = 1st Cavs LeBron (prime) = Miami LeBron (prime) > [Duncan (prime)] > Jordan (peak) > Duncan (peak) > Kareem (peak) > 2nd Cavs LeBron
E. ~~~ Player Comparison ~~~ Versus LeBron: Jordan wins in 7/10 of the plus-minus stats (8/10 against 1st Cavs LeBron; 10/10 against Miami LeBron; 9/10 against 2nd Cavs LeBron), 3/5 of the WOWY stats, 5/6 of the box stats (against 1st Cavs LeBron; 6/6 against other stints), 7/10 of the team stats in peak years (7/10 against 1st Cavs LeBron, 9/10 against Miami LeBron; 10/10 against 2nd Cavs LeBron; Jordan’s ahead in 10/10 team stats in prime years). LeBron in his 1st Cleveland stint probably has the best statistical case of any of these players against Jordan. 1st Cavs LeBron is ahead in: 3-year playoff on/off (although not 3-year on, 5-year on, or 5-year on/off; and he’s behind early-Peak Jordan in 3-year playoff on/off), 3-year full season PIPM (but not postseason PIPM, or 5-year full season PIPM; and he’s behind early-Peak Jordan in 3-year full season PIPM), 3-year regular season Basketball Reference BPM (but not VORP or postseason BPM). Prime LeBron is ahead in the two raw WOWY stats (but not any adjusted WOWY stat). 1st Cavs LeBron’s team is ahead of peak Jordan’s team in 3 regular season stats (but no playoff stats, or full-season stats, and prime Jordan’s team is ahead in 10/10 team stats).
Plus minus stats are noisy, especially in smaller samples (e.g. 3-year playoff samples), as are WOWY stats. The stats seem close enough that if you especially value certain stats, or if your subjective analysis favors LeBron, there’s room to support that argument. But the more stable stats (e.g. 3-year Playoff Augmented Plus Minus, all 5-year samples, and nearly all box stats, all adjusted WOWY stats, and all the playoff/full-season team stats) favor Jordan. This agrees with my personal subjective analysis, so I favor peak Jordan over peak LeBron.
Miami LeBron is literally only ahead in 4-year regular season RAPM and regular season record, while LeBron in his 2nd Cavs stint is only ahead in 3-year playoff relative plus-minus. It’s hard to mount a statistical peak argument for these versions of LeBron over Jordan, unless you only use raw prime WOWY. But again, these stats have limitations and uncertainty ranges, so your subjective analysis is free to differ.
Versus Shaq: Jordan wins 8/11 of the plus-minus stats, 3/5 of the WOWY stats, 6/6 of the box stats, 9/10 of the team stats (in peak years; 7/10 of the team stats in prime years). Shaq’s just ahead in 3-year and 5-year playoff on/off, 3-year relative plus-minus, 10-year raw single-season WOWY and Moonbeam’s RWOWY. Shaq’s peak team is behind Jordan’s peak team in 9/10 team stats (all but regular season record), although prime Shaq’s peak team is ahead in a few single-playoff stats (playoff SRS, relative Net Rating, and record, all in 2001). Overall more stats favor Jordan, but this set of playoff plus minus stats, WOWY stats, and team stats gives peak Shaq a better argument than some of the following players.
Versus Kareem: Jordan wins 3/4 of the plus minus stats, 5/5 of the WOWY stats, 6/6 of the box stats, 10/10 team stats (in peak years; 9/10 team stats in prime years). Kareem’s just ahead in 3-year playoff PIPM, which has a reputation for being higher on big men. Jordan’s peak team is ahead of Kareem’s peak team in 10/10 team stats, although Prime Kareem’s team sneaks ahead in 1/10 team stats (regular season SRS in 1971).
Versus Wilt: We have no Wilt plus minus stats, but Jordan wins in 4/5 WOWY stats, 5/5 box stats, 9/9 team stats. Wilt is just ahead in Moonbeam’s RWOWY. If you use total WS instead of WS/48, Wilt’s ahead in regular season 3-year Win Shares, and I would expect him to be ahead in another simpler box stat like regular season Basketball Reference VORP if it went back far enough.
Versus Duncan: Jordan wins 10/11 plus minus stats, 4/5 WOWY stats, 6/6 box stats, 10/10 team stats. Duncan is just ahead in 3-year postseason on/off, and 10-year raw single season WOWY. These are two of the noisiest stats, and indeed Duncan’s 3-year postseason on/off benefits from outlier shooting luck when on vs off.
The best playoff impact metric we have for Jordan is Augmented Plus Minus, which incorporates actual impact data (relative plus minus and on off), partially adjusts for teammates, and is relatively stable in smaller samples. Jordan is 1st all time in at least 1–5 year playoff samples. In our more stable ‘pure’ playoff impact metrics, Jordan’s first all time in 5-year relative Plus Minus. Early-Peak Jordan’s first among the usual GOAT peak candidates listed above in 5-year On/off (and he’s just behind Shaq when including 1991). In the regular season, his available multi-year peak on/off data (which is a sufficiently large, randomly chosen sample to not be just noise or significantly biased) clears the other usual GOAT peak candidates (save Curry if you count him). It’s difficult to compare RAPM across samples, but his multi-year regular season RAPM data supports him being the clear most impactful regular season player of the late 80s through the mid/late 90s, in Tier 1 for multi-year RAPM all-time.
Multiple times, people have shown many of Jordan’s raw WOWY samples are biased samples (he played only 50% of his expected minutes in ’86; he missed only 7 games from ‘87–93; the Bulls were coasting in ’93 and had large roster turnover in ’94; there’s consensus that he was still out of shape in ’95). Jordan’s not unique in this — these are just the usual sources of noise and bias for WOWY-style analysis. But by incorporating all available data, adjusted WOWY stats can help correct for these limitations (although biased samples might still be expected to drag down the adjusted value slightly). In adjusted WOWY metrics, Jordan universally has Top 10 impact ever, frequently above other GOAT peak/prime candidates, well within uncertainty range of having the GOAT peak. In box stats, Thinking Basketball BPM is the best metric on the market (it’s only 2% worse than APM in measuring impact, and it measure defense/creation more accurately than other box stats). Jordan has the GOAT peak in this BPM in at least 1-5 year regular season and playoff samples. Jordan likewise looks GOAT-level in most other box stats. And finally, Jordan has better team performance than all the usual GOAT peak candidates (save Curry if you count him), including in 1991 during his consensus peak.
Now, these stats are not definitive. They cannot replace other forms of analysis. Many of them have large error bars, so other players could still be argued to be the most valuable. And we’re lacking complete impact metrics for many players, including some impact metrics for Jordan. We have no plus minus data for peak Kareem or anything for Wilt. But it’s pretty clear that in the stats we do have, Jordan is the most common player ranked as having the best peak.
Some might argue we should relax the year requirement and thus combine a player’s best performance in stats in non-overlapping timespans (e.g. rank LeBron based on his 3-year PS On/off from 2008-2010, but also rank him based on his 3-year PS relative On from 2016-2018). Relaxing the year requirement would actually still help Jordan: e.g. he would then improve to be 1st all time 5-year PS on/off, 3-year PS relative Plus Minus, 3-year full season PIPM, and would improve in other stats as well (he’d improve across all team stats).
Others might argue we should emphasize different sample sizes, e.g. specifically focusing on single-season samples or even single-playoff samples. The smaller the sample, the noisier the data, and so we’re less likely to have a single player dominate all stats, even if they truly did have the clear-cut GOAT peak. Still others might argue we should take a different treatment of multi-year data, e.g. forcing us to take a single multi-year span (e.g. 89–91 Jordan) rather than simply requiring that the peak year be included. People are welcome to emphasize different sample sizes than I did, and that might change the rankings slightly. For example, I haven’t checked 2-year or 4-year samples in as much detail, and these may be more favorable to other players.There are multiple valid treatments of multi year data.
But at least in this survey, in the stats we do have, across a variety of sample sizes, in both the regular season and postseason, across every major category — plus minus stats, WOWY stats, box stats, team stats — Jordan has the most 1st place rankings, and is the most consistent player near the top of the list, including in many of our more accurate stats. At least statistically, Jordan seems to be favored for GOAT peak.
Other Possible Stats I have not checked:
Spoiler:
There are a few additional stats that might be computed from available data, but haven’t yet. 1. Regular Season Augmented Plus Minus: We have the formula, the partial data for Jordan’s plus minus, and the partial data for Jordan’s teammates’ plus minus. Given Jordan’s advantage in Tanking Basketball BPM and his regular season plus minus, it’s almost certain he’s 1st all time in regular season peak samples, but the calculation has not been made. 2. Regular Season and Playoff PIPM: We have the formula, the partial data for Jordan’s plus minus, and (in the regular season) the partial data for Jordan’s teammates’ plus minus. 3. Regular Season relative Plus Minus: We have the partial data for Jordan, but no one’s calculated Jordan’s average data and compared it to all other modern players. It’s likely Jordan’s above the other typical GOAT peak candidates, but behind certain typical all-time / Strong MVP peak candidates (e.g. Curry). But we’d have to calculate to be sure. 4. Full Season relative Plus Minus and On-off: We have the partial data for Jordan, but no one’s calculated Jordan’s average data and compared it to all other modern players. Jordan’s likely 1st all time in full season On-off, and likely not 1st (but potentially above other typical GOAT peak candidates) in full-season relative Plus Minus. But we’d have to calculate to be sure. 5. RAPM: There are no single RAPM datasets that include Squared2020’s historical data (which contains Jordan’s true peak) and modern players. Different RAPM samples scale differently, so the number can’t be just compared. However, we might calculate an approximate comparison between different samples (e.g. Squared2020’s single-season RAPM or multi-year RAPM) by standardizing each list, then comparing the resulting value/z-score. As above, Jordan’s likely among Tier 1 players, but it’s unclear what the exact rankings are before calculating. I haven’t had the time to add these to the list. If others would like to, feel free to add these!
Sources and notes:
Spoiler:
A. Plus-Minus Stats (and box estimates of plus-minus stats) 1. 3-Year Postseason Augmented Plus Minus (since 1997 + prime Jordan): Thinking Basketball. Units are AuPM per game, to get a total volume rather than their rate of performance. Per game is necessary to correct for varying postseason lengths. AuPM incorporates actual plus minus data (on/off) and box stats into an impact metric that doesn’t miss subtle non-box abilities like defensive deterrence and off-ball creation, while being relatively stable in samples as small as 1–3 playoffs. Note: in partial samples earlier (greatest peaks series), Jordan was 2nd all time behind Duncan, but has since surpassed everyone with a larger sample.
[/url] ). Units are PIPM [wins added] per game, to get a total volume (labeled as wins added in the database) rather than their rate of performance. Per game is necessary to correct for varying postseason lengths. Note I’m only including one sample from each player; the Thinking Basketball video ranks Jordan 3rd because he’s below 2 adjacent Kareem samples (1974/1977–78 and 1977–79, see PIPM database), but since we’re just discussing player rankings, having peak Jordan only behind Kareem means he’s the 2nd best peak (player) of all time, in the PIPM sample. *3. 3-year Postseason RAPTOR (since 1977): RAPTOR database (article here: https://projects.fivethirtyeight.com/nba-player-ratings/; historical data here: https://github.com/fivethirtyeight/data/blob/master/nba-raptor/README.md). Units are RAPTOR [wins above replacement] per game, to get total volume (labeled as wins above replacement in the database) rather than their rate of performance. Per game is necessary to correct for varying postseason lengths.
4. 3-year Postseason On/off (since 1997 + prime Jordan): Thinking Basketball video (The 10 Best NBA Peaks since 1977, [url]
[/url]), Thinking Basketball database / nba.com / pbpstats, and the lessthanjake realgm thread documenting this data. Units are on/off (per 48 minutes). There’s a fairly conservative threshold of at least 1000 minutes played and 200 off-court minutes (this filters out Ray Allen’s sample) and again I’m only taking one sample per player as their peak (this filters out a 2nd sample from David Robinson, Garnett, and Shaq).
5. 5-year Postseason On/off (since 1997 + prime Jordan): Thinking Basketball for Jordan (Note: Jordan stays 2nd all-time whether you use Thinking Basketball or Djoker/Dipper13 for the source. They have slight disagreements due to errors in hand-tracking). Source is pbpstats and nba.com for others (post-2000 and pre-2000 respectively). Units are on/off per 48 minutes. There’s a fairly conservative threshold of at least 1000 minutes played and 300 off-court minutes and again I’m only taking one sample per payer as their peak. A longer list is summarized here: https://forums.realgm.com/boards/viewtopic.php?p=112619612#p112619612.
6. 3-year Postseason relative Plus Minus (among MVPs/FMVPs since 1997 + prime Jordan): Thinking Basketball for Jordan, pbpstats and nba.com for others (post-2000 and pre-2000 respectively). Units are On per 48 minutes. There’s a fairly conservative threshold of at least 1000 minutes played and 200 off-court minutes. Why relative? Unlike in the regular season when players face approximately equal competition, varying strengths of schedule / opponent difficulties would dominate raw Plus Minus in the playoffs. Opponent difficulty is estimated based on minute-weighted average SRS, taken from basketball reference. A true measure would base this off the actual opposing lineups to calculate playoff RAPM, but we don’t have the data to calculate playoff RAPM for Jordan, so this is the next best approximation.
*8. Full Season 3-year PIPM (since 1974): PIPM Database (https://docs.google.com/spreadsheets/d/1Pz7HAuWUukuQnEC_EXlo-wAtwG7-fTJHjt9Zlt0vDD8/edit?usp=sharing) . Units are total PIPM per game, to get a total volume rather than their rate of performance. Per game is necessary to correct for varying postseason lengths. I do *not* correct for missed games (e.g. you might multiply each per game value by the percentage of games played). This would hurt Jordan the least, as Kareem, Shaq, Duncan, and LeBron all missed a greater percentage of games during their 3-year runs than Jordan did.
10. Regular Season 5-year On-off (since 1994 + Squared2020/Pollack earlier): Squared2020 and Thinking Basketball for Jordan (posted in this thread: https://forums.realgm.com/boards/viewtopic.php?t=2314587). For others, sources are Pollack (1994-1996), nba.com (1997-2000), pbpstats (post-2000). Units are per 48 minutes. For Jordan, we only have partial data in 1988 (42 regular season games), 1990 (56 games), 1991 (56 games), and 1992 (55 games). There is enough data to have a clear signal, but there’s still more noise and systematic uncertainty for Jordan than for the others, so Jordan’s error bars are bigger.
The unusual spread of the data makes it infeasible to apply a similar unequal sampling to other players, nor would it be appropriate. Good statistical practice dictates we use the best data we can and acknowledge error bars; we have better data for other players, so we keep their error bars small (and do not arbitrarily ignore available data to try to mimic Jordan’s partial sampling), while acknowledging Jordan’s higher error bars.
Is the sample for Jordan biased? In Squared2020's documentation, Jordan’s team over performed by ~ +2.5% in 1988, underperformed by ~4.8% in 1990, and underperformed by ~13.4% in 1991. We don’t know which players underperformed in on-off in these samples, but naively we would expect most players on the Bulls (including Jordan) to perform marginally *better* on average if we had the full data.
Given the available data, it’s uncertainty, and the bias, it is reasonably unlikely that Jordan’s on/off in the missing data would be low enough to put him below any sample for Shaq/Duncan/LeBron. But it’s quite possible his true ranking might change to e.g. 1st all time or 3rd all time rather than 2nd all time, given the wider uncertainty bars for him.
*Note that for stats 2, 3, 8, 9 (i.e. PIPM and RAPTOR), we use box-estimates instead of real plus minus data for the pre-1997 seasons. No, this is not a perfect comparison. But! The box estimates are designed explicitly to mimic the real plus-minus metric as closely as possible, with the explicit intention of allowing comparison to earlier eras. Indeed, fivethirtyeigh has published articles (e.g. https://fivethirtyeight.com/features/lebron-or-mj-raptor-picks-the-best-nba-players-of-the-past-40-years/) comparing players from pre-1997 to post-1997 using RAPTOR. It's as fair a statistical comparison as we can make, given available data. We use what we have, and acknowledge limitations/biases/uncertainties.
B. Prime WOWY-based stats 11. Raw 10-year prime WOWY (since 1955): 32nd all time. Thinking Basketball Database (https://thinkingbasketball.net/2016/08/24/i-historical-impact-wowy-score-update/) / Thinking Basketball Top 40 project articles (https://thinkingbasketball.net/2017/12/11/the-backpicks-goat-the-40-best-careers-in-nba-history/). Units are WOWY per game. 12. Raw 10-year prime multi-year WOWY (out of standard Top 15 players): RealGM Multi-year WOWY database (me! viewtopic.php?t=2310915). Units are WOWY per game. This includes data from e.g. team-changes, rookie years joining an NBA team, and retirements leaving an NBA team. Between stat 9 and 10, this covers all available raw WOWY data. 13. 10-year prime WOWYR (since 1955): Thinking Basketball WOWYR Database (https://thinkingbasketball.net/metrics/wowyr/). Units are WOWYR per game. 14. 10-year prime GPM (since 1955): Thinking Basketball WOWYR Database (https://thinkingbasketball.net/metrics/wowyr/). Units are GPM per game. 15. Moonbeam’s 5-year RWOWY (since 1952): Moonbeam’s RWOWY thread (https://forums.realgm.com/boards/viewtopic.php?f=64&t=2311737). Units are RWOWY Percentiles (calculated from per game RWOWY relative to era). Note: Moonbeam has not posted specific rankings for player. He just gives percentiles for each 5-year sample. However! Given Moonbeam’s plots and the drive folder, we can manually find each player’s percentiles over their career, and thus compare their in-era performance. Given how noisy even 5-year adjusted WOWY is, I’ll be looking at their performance over their whole career, and seeing how often they hit high percentiles. Here’s how some standard Top 5 Peak candidates perform, roughly in order: -Wilt: 7 samples touching 100th percentile line, 16–17 over 97th percentile, 18 over 90th percentile, -Shaq: 9 samples touching 100th percentile line, ~11+ samples over 97th percentile, 18 samples over 90th percentile -Jordan: 8 samples touching 100th percentile line, 9 samples over 97th percentile, 14 over 90th percentile -LeBron: 4 samples touching 100th percentile line, 8-9 samples over 97th percentile, 13 over 90th percentile -Duncan: 5 samples touching 100th percentile line, 6+ samples over 97th percentile, 11 samples over 90th percentile -Curry: 4 samples touching 100th percentile, 6 over 97th percentile, 9 over 90th percentile, 13 over 75th percentile -Kareem: 0 samples touching 100th percentile line, 0 over 97th percentile, 14 over 90th percentile. To my eye, this suggests RWOWY favors Wilt >~ Shaq >~ Jordan >~ LeBron >~ Duncan >~ Curry >~ Kareem. You might bump e.g. Shaq over Wilt if you value a few more samples touching the 100th percentile line at the cost of fewer samples over the 97th percentile line. But Jordan pretty clearly has significantly more ~100th percentile performances than anyone listed below him. I have the same analysis for all the best players according to RWOWY, if people want to look at the more complete ranking list.
C. Box stats 16. (1-year, 3-year, 5-year) Postseason BPM (since 1955): Thinking Basketball Database. 17. (1-year, 3-year, 5-year) Regular Season BPM (since 1955): Thinking Basketball Database. Note Thinking Basketball BPM is the most accurate box stat on the market, rating only 2% under APM and PIPM (far above PER) in accuracy of evaluating current season value, while actually outperforming APM and PIPM in predicting future value since 1998 (see, e.g. https://fansided.com/2019/01/08/nylon-calculus-best-advanced-stat/, or https://www.nbastuffer.com/analytics101/darko-daily-plus-minus/). It makes specific methodological changes to do a better job capturing defense (Russell has the 6th best career in Backpicks VORP since 2018, despite only playing 13 seasons and shorter playoffs, compared to Basketball Reference VORP ranking Russell 20th). It also does a better job at measuring playmaking (Magic has the 5th best career in Backpicks VORP, compared to Basketball Reference VORP ranking Magic 26th). And Jordan is clearly 1st peak all time since 1955 in any peak time span. See here for BPM VORP since 2018:[url]
Voting post: Based on a pretty in-depth survey of GOAT-level impact metrics in the prior post (and for a variety of film analysis and qualitative analysis that I spoke about in detail in the last Greatest Peaks and Top 100 Projects ), I vote
1. 1991 Michael Jordan Alternate years: 1991 > 1990 > 1989. The GOAT peak, with the impact metrics, team performance, and film to support it
2. 2016 LeBron James Alternate years: 2016 > 2013 > 2009. LeBron's 2009 single-year statistical performance is best, but his multi-year consistency, team performance, playoff-specific plus minus portfolio (e.g. relative Plus Minus), scalability/portability/resilience, and on film skillset lead me to look at the other years. Open to being convinced on the ordering of the years. LeBron's definitely within uncertainty of Jordan. If some hybrid LeBron were able to combine some of the best abilities of different versions of LeBron, that would probably be enough to push him over. But as is, LeBron's best peak stretches are a touch lower -- his defense, scoring, playmaking, athleticism, IQ, versatility/scalability, and playoff resilience all peaked across a wide range of years. Which helped boost his prime consistency... at the cost of single-peak stretch impact. Which is no shame -- being 2nd all time in peak with GOAT level longevity makes for a pretty compelling case at having GOAT career impact. But just because LeBron might have GOAT total career impact doesn't mean he also must have the GOAT peak.
3. 2000 Shaq. Underwhelming regular season performances, but GOAT level playoff plus minus portfolio consistent with fantastic all-time tier performance in film, along with all time/GOAT level WOWY performance. Unique combination of off-ball/on-ball gravity for a big man provides some great intangibles that help explain why he's slightly lower in box performance. Positive scalability and resilience supported by fantastic team performance. Shaq was capable of leading a GOAT-level team with all-time ceiling raising, which is what I look for in my GOAT peaks (although the 2001 Lakers are perhaps slightly too dependent on hot playoff shooting, and I suspect people slightly overrate this single playoff run when thinking there's a clear gap after Shaq's and the next guy).
Not sure how nominations work for next players, but I would nominate players in this order: -1977 Kareem -2017 Curry -- who I suspect will be underrated in this project. -1967 Wilt
1. 2009-10 Lebron James (08-09, 11-12, 12-13, 15-16, 16-17, 17-18):
A better version of the previous year Lebron which was
-> By far the most important defender of a -5 defense -> All-time creator -> Arguably the greatest scoring postseason in history -> GOAT lvl defensive communicator -> Great rim protection and man defense -> GOAT lvl rim pressure and finishing
And defensively, he didn't drop-off THAT much, from his defensive peak, which is a DPOY to strong DPOY peak(one of best defensive peaks ever by a non-big).
The defensive part is backed up with the fact that they got a -5 defense anchored by Lebron. I would say this team is a good defensive team, with players like Ben, Big Z, Varejao, etc.
Then the very next year he anchored a -3.5 defense, this is now without a Ben Wallace (replaced with a negative Shaq), a diminished Varejao and Big Z. Similar drop-off to when he left compared to the 08-09 Cavs.
A lot of people like to point out that Boston series where he supposedly "choked", but he was excellent defensively that series. But he was still limiting Pierce (a sub-offensive superstar), to the worst series he had that year. So it's not like he had terrible personnel, he still had sub-ATG personnel in that series.
And on top of this, he still has all of the actual basketball defensive game he had from his defensive peak, just got slightly worse.
And here's some tracking for those who are interested in eye-test:
Lebron got more polished, with a better jumper and also GOAT lvl playmaking, with increased bball IQ.
Has arguably best RS offensively in NBA history, with much better jumper and better bball IQ, along with better playmaking.
His series against Boston offensively wasn't great by his standards, but it was still ahead of some series from ATG offensive players like 08 Kobe vs Celtics, 86 Bird vs Rockets, 64 Wilt vs Boston, etc.
In the prior series in the PO, is where his Bulls series was still an ATG series, offensively at least.
And here is what happens when Lebron takes over Mo as the point guard, becoming helio player:
And as he left Cleveland, before they just tried to stop winning, they dropped to a 13 win pace by NRTG (-12.2 NRTG!!) https://www.statmuse.com/nba/ask q=cavs+nrtg+from+oct+27%2C+2010+to+jan+15%2C+2011
For those who just want the record, they went 8-32, a mediocre 16 win pace. This was before they tried to stop winning, proving how amazing Lebron leading that cast to a 60-22 record, and a +7.1 NRTG (59 win pace) is. Quite incredible floor raising season.
2. 1976-77 Kareem (70-71, 71-72, 73-74, 79-80)
We have an ATG offensive and defensive player, having an incredible carry-job on both ends of the floor in the RS (mediocre LA goes to 53 wins).
It gets better in PO, with much worse situation without Kermit Washington and playing with injured Lucius Allen. Kareem then had to do everything for Lakers on both ends, to help cover for their team's defensive mistakes. He averaged 31.6 IA pts/75, 17.7 rpg, 3.7 IA ast/75 on +13.7 rTS. So with this comes a season with - GOAT lvl scoring, best in-league rebounder, and ATG defender, and great creator. This is leading to a GOAT lvl floor raising season, unlike one you will ever see.
According to 70sFan sample size, Kareem actually made a high amount of his skyhooks.
70sFan wrote: His skyhook efficiency was also absurd in sampled games. He made 35/56 attempts in sampled games, which given linear adjustment leads us to 62% on over 8 attempts per game.
He improved his strength so he can deal with centers and not struggle with players like Wilt and Thurmond, so then he went on to obliterate the player that is my 16th best peak of all time (77 Walton), here is some tracking from Falco showing this:
falcolombardi wrote:
Spoiler:
I was so impressed with 77 kareem that i tracked one of his games agaunst walton to show how nuts he a actually was
2:15 kareem blocks 7'2(?) Bill walton move, absurd reach
2:30 7'2 walton sits on kareem hip to deny him the skyhook, kareen punishes this easily for a easy basket. His counter game may not ve as flashy as hakeem's but is probably just as effective or more
3:00 small mistake by kareem to let walton easily pass tge ball over him to a cutter
3:16 notice how walton sells out to front kareem at the sacrifice of forgetting about rim protection, this is curry/shaq level defense warping when a team center gives up on defending the paint so he can slow down a isolation post up scorer
3:35 walton got the rebound but notice how kareem lenght stops a lay up, kareem was a steong rim protector
6:55 walton tries to front kareem but the entry pass is way too high and kareem too strong so he can move walton to make himselg space, finishes against the walton and teammated double team with ease by using the backboard
8:15 gets essentially soft tripled in the block by walton +2 portland players, recognizes this and throws a quick pass inside to the cutter, great defense deflects the pass but i though the pass was good
8:50 notice this sequence, kareem is essentiallt fronted by walton again who is more focused on kareem than the rim, kareem sets a high iq screen to free the running shooter and then quickly moves to gain rebounding position on walton before bill reacts
9:15 walton overplays the skyhook again and gets easily burned with the counter move, bill is basically a prop against Kareem scoring
9:35 not a bad effort in a vacuum, but this is an area where a russel, garnett or hakeem probably at least gets and attempt to block that in a chase down and may ruin the basket
11:40 walton fronts kareem again, kareem brilliantlt counters this with a quick moce to the other block for a instant layup, brilliant counter
12:40 first skyhook of the night, nothingh but net, notice he moves off ball to receive in a good angle and inmediately throws the shot no time wasted and still comes perfect
13:00 hwre i think kareem can receive a small criticism for not being mor3 proactive ar denying walton the entry pass or trying to push him away before he can receive in position, he has th3 strenght for it but doesnt use it
13:10 great read in the pass slightly off the mark and gets deflected
15:15 this sequence shows walton edge as a passer, notice how is a tougher passing angle made in an instant to avoid kareem long arms, walton probably hits the pass at 13:10
15:30 walton is so desperate to deny kareem skyhook that he overplays his left side (essentially fronting him) and kareem easily scores again of the quick turn and catch and quickly shooting against help, evenwalton is essentially powerless to slow down kareem scoring
18:05 notice the soft triple team to prevent the pass to kareem on the block
18:55 this was a laker basket but is a minor criticism i have on kareem, he more or less walks after tge missed shot and doesnt join the fast break, another big may have ran the court and got a easy score there whereas fiest quarter kareem didnt put in the effort
19:10 Kareem dhalsim-esque reach gets him another easy block
20:10 Kareem absurd mr fantastic reach gives him a offensive rebound most 7 footers couldn't reach for and a immediate skyhook on poor Walton
This all happens in a single quarter but the whole game is worth watching
Kareem goes like 90% from the field in this game which is admittedly unusual
Notice that lakers get away with kareem guarding walton on a island effectively (he doesn't completely shut Walton down but makes him live of tough shots) and Walton and blazers sell out to prevent Kareem of even catching and he still burns them for their troubles
There are some possessions later on the game where Walton stays glued to Kareem face and lets open driving lanes to lakers players, others where kareem easily pushes fronting walton to make himself space to catch (there is one mentioned above) open jumpers from multiple blazers players staying close to Kareem
Kareem essentially requires bill walton and multiple blazers attention before even catching and still manages to easily score
In the defensive end his rim protection deters blazers players from driving (almost all their shots inside come from Walton passes to cutters when kareem is away of the hoop guarding him or off lakers turnovers and fastbreaks) and he gets tons of blocks and contested shots inside
His passing is solid and willing although sometimes a bit slow or off the mark
+++rim protection
+++ 1vs1 defense
+++++ 1vs1 scoring
+++ off ball movement to score
+++ rebounding defense and offense
++ passer (sometimes a tad slow to pass before the layup/open jumper vanishes or the pass is slightly imprecise, but the vision is strong)
- for sometimes not putting effort in loose-ball situations or running in fastbreaks (both offense and defense), somewhat stationary in the paint but this may be by design
3. 1999-00 Shaq (97-98, 00-01, 01-02)
Another big man in Shaq, tough choice between Kareem and Shaq, ultimately I lean Kareem due to much better defense, but I will admit that Shaq has a case, with his sub-GOAT tier offensive game, and with him still being a DPOY level defender.
Shaquille O'Neal's game is about him on the post/rim. As we know he can't stretch the floor well even like other bigs, so he relied on working for post position. Also exposed mismatches well in post, great iso player there. A great offensive rebounder, also an efficient scorer (Shaq RS: 30.3 IA pts/75 on +5.5 rTS, Shaq in PO: 29.9 IA pts/75 on +3.9 rTS). Shaq drawing fouls generating baskets did help, but it made him easier to scheme against.
Also I value his gravity, opening up floor for teammates, giving him much more value as a playmaker. He is one of the best off-ball playmakers ever in this season as well, due to his gravity. Here is what that led to, by my tracking of 00 Shaq Finals Game 2 (surprisingly, his defense isn't all that great, making me lower on this Shaq) -
Top10alltime wrote:My 00 Shaq tracking for the g2 finals
Shaq had GOAT lvl gravity and scoring this game, but that increased his playmaking advantage (among others) greatly.
He also showed that he could still lift the team without his second option, proving his sub-GOAT floor raising:
colts18 wrote:Without Kobe: Kobe started the 2000 season injured. He missed all of November. During that time, the Lakers and Shaq didn’t miss a beat at all.
11-3 record 6.61 SRS (would still be good enough to be #1 in the league)
More impressively is how the Lakers performed when Shaq was on the court during that span that Kobe missed. 107 O rating (+6.8 from League average) 94.3 D rating (-7.0 from league average) +12.7 Net Rating
The most amazing thing about the above numbers is that Shaq’s full season numbers were 106 O rating and 95 D rating (11 Net) so that means the Lakers with Shaq on the court while Kobe didn’t play, played better offense and defense than the Lakers played with Shaq on the court in the games Kobe played. Shaq really stepped it up in that span.
Here is Shaq’s supporting cast during those games: 36 year old Ron Harper, 7 PPG 39.9 FG% 25 year old Derek Fisher, 6 PPG, 34.6 FG% 32 year old Glen Rice, 15.9 PPG, 43 FG% 36 year old A.C. Green, 5 PPG 44.7 FG% 2000 Shaq
Bench, Brian Shaw Rick Fox Robert Horry Travis Knight John Celestand
Despite all of that, Shaq performed just as well and somehow got an on court 107 Offensive rating (+6.8 from league average) with Shaq on court. To put that into perspective, the #2 offense this year (Heat) are +6.5. They also played -7.0 defense which is the exact same that the 2011 Bulls and Celtics played.
In that month without Kobe, while the team played awesome with Shaq on the court, they were horrific without Shaq in that month
On court: +12 per 100 Off court: -44 in 197 minutes, (-11.17 per 100) +23.19 per 100 possession difference
So Shaq was propping up a mediocre at best cast in Kobe’s absence to playing like the best team in the league when Shaq was on the court.
To show Shaq's true dominance at the rim, here are his FG% numbers: FG% from 0-3 FT: 77.6% (ATG to sub-GOAT lvl) FG% from 3-10 FT: 44.8% (efficient, still great)
Shaq was much more unstoppable, in this limited area, due to how he could finish, his GOAT rim-pressure, and his area in deep post, where he could dunk(14.7% of his shot attempts are dunks). His physical game was incredible as-well, as he overpowered opponents in this area.
2000-01 Shaq has an argument, based on if you value the PO that much (his best playoff run in his career), but for me, it is not enough to beat out his excellent RS and PO combination, as well as his DPOY lvl defensive peak.
HM:
1963-64 Wilt: Very close for him and my 3rd spot. he is an ATG lvl defender with his rim protection/detterence, was more available to defending space this year, shot-blocking skills, sub-GOAT lvl defensive anchor, etc. His offense is OPOY lvl that season with what was arguably his greatest scoring season, combined with very good playmaking. Looks like his best season, and better than any of Duncan, Hakeem, or Jordan's seasons. Ima take Wilt as my #4.
1 to me is 1994 Hakeem Olajuwon. He has the NBA's most valuable player award, NBA Finals Most Valuable Player Award, Defensive Player of the Year in one season and a great playoff run. He did not win by himself but I think his efforts to win are unmatched. I give 2 to 2003 Tim Duncan. He was not DPOY but he was dominant two ways and stopped a three-peat Los Angeles Lakers with team not yet great. I think for 3 I will give 2013 Lebron. I always have high respect for Jordan but I must say I'm highly impressed by the Lebron case made here today. I add simply he almost won Unanimous NBA's Most Valuable Player and Defensive Player of the Year.
1 94 Hakeem Olajuwon 2 03 Tim Duncan 3 13 Lebron James
Okay. I have very tough decision at the top. I have thought for long time Jordan is the peak of peaks but I think I will vote Lebron first. Year 2016.
Here is why.
First I must acknowledge. The Lebron rationale is more convincing. It seems like an analyse of basketball. I thought it would be RAPM and With and without and on offs but they’re offering fresh perspective with film and stats together. I appreciate this.
Second I think I must say I missed some things about Lebron. His playmaking much better than I thought it would be. I always assumed Lebron style basketball was misleading in terms of assists but actually ast maybe underrates.
Third and final I think my impression of Lebron ball was wrong. I must say none of below is mine. This is part of some analyse Elpollo_14 is working on but I found it shocking —--- —---- Take look at Lebron in 2009 with 8-assist game when it said they only let Lebron touch ball.
RESUME: 69 DTOS, 34 EDTOS, total poss when MJ on floor - 86[//spoiler]
.80 DTO pp and .39 EDTO.
Jordan has ball much much more than Lebron in this game. Jordan only scores 30 while Lebron scores 40 more effeciently. I say not to say Lebron is better scorer but this game favors MJ when talking playmaking balance. It’s big big outlier for MJ.
Look what happens when MJ play in system. To be fairest I pick highest assist game - 13 Assist.
[spoiler]RESUME Game 2 MJ 1991 offensively Total Possession when MJ was in the floor – 61 Total Possession of play MJ have action both on/off ball – 58 Total Possession of play MJ didn’t affect or didn’t have the opportunity to affect – 3 Playmaking DTOs - 41 EDTOs – 17 ADAs – 4 Double - 8 Triple - 0 Création - 14 R’Creation ( Rim ) - 8 P’Creation ( Prerimeter ) - 6 SC ( Screen ) - 0 EPDL( Elite pass delivery ) - 7 RPDL ( Regular pass delivery ) - 13 BRDL ( Bad pass delivery ) – 3 BB ( Bring ball up ) - 22
MJ only have .67 DTO PP and .28 EDTO PP. He actually bring ball up MORE than Lebron in 2009. But his playmaking still collapse. —---------------- —--------------- Lebron brings ball less in 2009 when its peak of Lebron ball than Jordan in Triangle. If this is true I don’t know how I can say Lebron makes offenses all about him. I also have to acquiesce his defense is better so I think it’s going to have to be Lebron James for this vote.
Jordan second. Year 1991. Peak of peaks. Must acknowledge how dominant his teams are. Three-peating was thought as impossible and he did it twice. Ask 2025 Boston or 2019 Golden State how hard winning is. But. I think I must admit. If I cannot put Russell ahead with his 11 championships. Then I’m not sure I can put Jordan ahead of Lebron just because of championships.
Bill Russell third. Year 1969
It is hard to back a player who scores so little and only affects one side of the floor. But the results are incredible. And I must admit what he did last seems more impressive to me than anyone else’s accomplishments if I close my eyes and overlook the hole on offense.
The Case for 1991 Michael Jordan as the Greatest Peak of All Time
Jordan's case has always been taken for granted but here is a detailed statistical case laid out. DraymondGold above did a fantastic job gathering the Advanced Stats so I'll include the ones he didn't have in my post here.
Quite simply, Jordan's 1991 season is the best season ever in terms of: 1) box score dominance 2) impact 3) team dominance 4) defense 5) clutch play 6) accolades 7) skill set + intangibles
1991 Jordan truly put it all together!
Box Score Dominance
In terms of simple box scores, 1991 Jordan just dominates in the postseason. If we take all the 32 best runs by offensive centerpieces since the merger and compare them, it becomes abundantly clear. I listed him as #1 if only other Jordan seasons are higher.
rTS% is the only category he isn't #1 and he's scoring at the highest volume of anyone. #1 in Box Creation and #1 in cTOV% (adjusted turnover rate) is just crazy and goes to show just how efficient he is offensively despite carrying the #1 highest offensive load.
Impact
1991 Postseason ON-OFF Numbers
A decidedly bonkers 119.5 ORtg (+13.3) when Jordan is on the court in the 1991 playoffs!
The only three higher ones by offensive centerpieces in a championship run are Curry in 2017 with 126.0 ORtg (+18.5), Lebron in 2016 with 118.2 ORtg (+14.2) and Magic in 1985 with 120.6 (+13.4). But it gets more interesting...
With just the last three rounds (cutting out the 1st rounds against minnows), the Bulls jump up to 121.6 ORtg (+15.7) with Jordan on the court which clearly surpasses both Lebron 2016 who posts 118.0 ORtg (+13.7) and 1985 Magic who posts 118.4 ORtg (+11.1). Only 2017 Curry is still ahead.
I find that Jordan's 1991 playoff run is probably the most impressive offensive run ever. Pippen was a good secondary star but not an offensive dynamo and there were some good shooters on the roster (Paxson, Armstrong, Hodges) but the offensive talent of this Bulls team and the schematic approach (i.e. little 3pt shooting) just don't compare to teams like the 2017 Warriors, 2016 Cavaliers, 2001 Lakers etc. Jordan's huge scoring load with strong efficiency, volume playmaking (one of the highest box creations ever in 1991) and historically low turnovers made him the most effective offensive player ever at his peak in my book. It's also worth noting that the Bulls didn't sacrifice defense to produce that offense. They were an elite team on both ends of the floor.
3-year Regular Season ON-OFF
Squared2020 and Dipper13 logged 167 out of a possible 246 Bulls' regular season games from 1990-1992 which is just over two thirds (67.9%) of the total sample and this is Jordan's ON/OFF data:
ON: 115.7 ORtg (+7.6), 105.4 DRtg (-2.7), +10.3 Net Rtg OFF: 97.3 ORtg (-10.8), 108.9 DRtg (+0.8), -11.6 Net Rtg ON-OFF: +17.4 ORtg, -3.5 DRtg, +21.9 Net Rtg
And the crazy thing is that in the 79 unsampled games, the Bulls have a 69-10 record with a +12.0 MOV. In other words, that ON Net Rtg is likely to stay up in the stratosphere and even go up.
5-Year Postseason ON-OFF
RAPM (Squared2020)
Jordan is 1st in 1988 RAPM, close 2nd in 1990 RAPM, 1st in 1991 RAPM, 1st in 1993 RAPM, and 1st in 1996 RAPM.
CORP Model (Thinking Basketball)
1991 Jordan has the highest CORP value of any player in history at 31.2%.
RAPTOR WAR
This is cumulative value for the whole year: regular season + playoffs.
Jordan has the #1 result and 7 of the top 9.
Team Dominance
The Bulls are the most dominant dynasty in the NBA in the last 55 years.
From Sansterre's 1991 Bulls Article
(Also talks about Jordan's all-around game at the end...
Stats on the Team:
Overall SRS: +12.90, Standard Deviations: +2.47, Won NBA Finals (Preseason 4th)
PG: John Paxson, +0.3 / -0.8 SG: Michael Jordan, +12.0 / +14.6 SF: Scottie Pippen, +5.8 / +6.5 PF: Horace Grant, +2.5 / +2.2 C: Bill Cartwright, -2.6 / -1.2
Regular Season Metrics:
Regular Season Record: 61-21, Regular Season SRS: +8.57 (14th), Earned the 1 Seed Regular Season Offensive Rating: +6.7 (11th), Regular Season Defensive Rating: -2.7 (64th) Shooting Advantage: +2.8%, Possession Advantage: +3.4 shooting possessions per game
Michael Jordan (SG, 27): 39 MPPG, 32% OLoad, 33 / 6 / 6 / 4 on +7.1% Scottie Pippen (SF, 25): 38 MPPG, 23% OLoad, 19 / 8 / 7 / 4 on +2.7% John Paxson (PG, 30): 25 MPPG, 16% OLoad, 9 / 1 / 4 / 1 on +6.2% Bill Cartwright (C, 33): 30 MPPG, 15% OLoad, 10 / 6 / 2 / 1 on -1.2% Horace Grant (PF, 25): 35 MPPG, 15% OLoad, 13 / 9 / 2 / 2 on +5.1%
Scoring/100: Michael Jordan (42.7 / +7.1%), Scottie Pippen (24.3 / +2.7%), Horace Grant (19.0 / +5.1%) Assists/100: Scottie Pippen (8.5), John Paxson (7.6), Michael Jordan (7.5)
Heliocentrism: 54.3% (4th of 84 teams) - Jordan Wingmen: 44.7% (16th) - Pippen & Grant Depth: 1.0% (82nd)
Playoff Metrics:
Playoff Offensive Rating: +6.48 (36th), Playoff Defensive Rating: -7.92 (18th) Playoff SRS: +15.73 (6th), Total SRS Increase through Playoffs: +6.38 (3rd) Shooting Advantage: +6.2%, Possession Advantage: -1.7 shooting possessions per game Average Playoff Opponent Offense: +2.92 (28th), Average Playoff Opponent Defense: -1.18 (69th)
Michael Jordan (SG, 27): 43 MPPG, 33% OLoad, 33 / 7 / 9 / 4 on +6.6% Scottie Pippen (SF, 25): 44 MPPG, 26% OLoad, 23 / 10 / 6 / 4 on +3.0% Bill Cartwright (C, 33): 32 MPPG, 15% OLoad, 10 / 5 / 2 / 1 on +0.9% Horace Grant (PF, 25): 42 MPPG, 14% OLoad, 14 / 9 / 2 / 1 on +8.6% John Paxson (PG, 30): 31 MPPG, 13% OLoad, 9 / 1 / 3 / 1 on +3.4%
Scoring/100: Michael Jordan (41.8 / +6.6%), Scottie Pippen (28.5 / +3.0%), Horace Grant (18.5 / +8.6%) Assists/100: Michael Jordan (11.2), Scottie Pippen (7.7), John Paxson (5.9)
Round 1: New York Knicks (-0.4), won 3-0, by +20.0 points per game (+19.6 SRS eq) Round 2: Philadelphia 76ers (+2.5), won 4-1, by +8.8 points per game (+11.3 SRS eq) Round 3: Detroit Pistons (+4.0), won 4-0, by +11.5 points per game (+15.5 SRS eq) Round 4: Los Angeles Lakers (+8.8), won 4-1, by +9.8 points per game (+18.6 SRS eq)
Offensive / Defensive Ratings from Opposition Regular Season Average:
New York Knicks: +8.8 / -12.9 Philadelphia 76ers: +10.8 / +0.8 Detroit Pistons: +17.0 / +0.3 Los Angeles Lakers: +10.7 / -7.6
Shooting Advantage / Possession Advantage per game (unadjusted):
New York Knicks: +5.1% / +10.2 Philadelphia 76ers: +1.0% / +6.5 Detroit Pistons: +6.1% / +0.5 Los Angeles Lakers: +4.3% / +4.3
Postseason Usage/Efficiency Change adjusted for Opposition:
John Paxson: -2.1% / -1.3% Michael Jordan: -0.2% / +1.0% Scottie Pippen: +3.4% / +1.8% Horace Grant: -1.2% / +5.0% Bill Cartwright: -0.3% / +3.8%
On Jordan: (Sansterre)
But here’s my point. Jordan was the best scorer in the league (and, you know, ever). He was also in the top 15% as a rebounder among non-bigs. He was also in the top 25% of passers, and the top 5% of playmakers. He was either the best or one of the best at not turning the ball over. And he was either the best defensive guard of this time or one of the Top 10%, depending on how you interpret the data.
Jordan was either the best or one of the best at every meaningful part of the game. That he was such a transcendent scorer means that the rest pales a bit by comparison. But I’m saying right now that Jordan would probably have been an all-star even if he’d only been an average scorer. Jordan may well have been the GOAT (depending on your criteria) and this ‘89-91 may well have been the highest peak ever (by modern metrics, it probably was) but to attribute both of those things to his scoring is to completely miss the sheer breadth of his excellence.
Defense
On top of being the best offensive player ever, he's also an elite defender. Here is the tracking data from the whole 1991 playoffs:
Jordan was very strong on defense through the East playoffs then struggled defending Magic in the Finals, most of it in Game 1 and Game 4 being overzealous fouling. One thing that's difficult to quantify is shot deterrence. While Magic was super effective when he went at Jordan, he did so at very low volume. By my crude estimation of defensive possessions, Magic only put up ~12 pts/75 possessions when defended by MJ compared to ~22 pts/75 possessions when defended by other Bulls. This was discussed at length earlier in the thread too.
All in all looking at MJ's defense, he not only played good man defense but caused a ton of damage off-ball. He helped effectively in many instances although that is something that is subjective so I didn't explicitly track it. He caused a ton of steals and deflections playing the passing lanes too. He even provided a lot of secondary paint protection rotating over to the rim to block shots. 29 blocks in 17 games is a super nice tally for a SG.
For those that say they aren't impressed by his defense, find me another player with these kind of metrics dFG%, steals, blocks, rim contest frequency etc. that isn't an elite defender.
Clutch Play
1990-1992 Playoffs - Crunch Time Performance - last 5 minutes of the 4th Quarter and OT, score within 5 points
Dipper13 tracked this and I can vouch for the accuracy of the numbers. Several posters on X did this tracking, posted their receipts and got even higher numbers.
Anyways peak Jordan was producing at such an insane rate in crunch time that it's normal to question how this could be true.
Accolades
1st Team All-NBA 1st Team All-Defense MVP Finals MVP Scoring Title
Skillset
We have the complete playoff shooting data for Jordan from Dipper13 with me also plugging a few small gaps.
In the 1991 playoffs, he shot 72.5% at the rim, 47.2% from midrange and 38.1% from the 3pt line. Elite 3-level scoring.
All in all, MJ is the most unstoppable scorer in NBA history not just based on his production but simply the inability to make adjustments to take away his scoring game. He had too many options.
Elite finisher at the rim Elite in the post Elite popping from midrange Elite going both left and right Elite in halfcourt and transition Elite on ball and off ball Elite at drawing fouls Elite at converting free throws Borderline elite at hitting 3's (~38% in that era was better than today)
Thanks to working with Tim Grover, MJ was also at his strongest starting in 1990 and even improved his vertical by a few inches.
MJ also peaked in terms of intangibles. He was always a monster mentally but now he could motivate his teammates even better than he could as a young player. The whole Bulls team had that killer mentality in 1991. They were not going to be denied.
Summary - GOAT box score production - GOAT-level impact metrics; does not lead in all but leads in most metrics we have as DraymondGold showed through direct comparisons - GOAT team dominance even though the 1991 Bulls were definitively not the most talented team ever; historic team offenses and ceiling raising - GOAT-level defender for a primeter player; he doesn't touch bigs in defensive impact but his numbers relative to perimeter players is top percentile - GOAT crunch-time performer - arguably the GOAT skill set + intangibles in 1991; great scorer ever in both output and well-roundedness; peaked as a playmaker and passer and did it at extremely high volume with very low turnovers; carried the highest offensive load ever to a dominant championship
Add me on Twitter/X - Djoker @Danko8c. I post a lot of stats.
Alternative Years: 1990, 1989, 1988, 1992, 1993 -- Honestly any of those might be the GOAT peak too because there isn't much dropoff but 1991 is just the culmination of everything.
See above post for details.
2. 1977 Kareem Abdul-Jabbar
Alternative Years: 1974, 1980
Why Kareem > Shaq and why 1977?
In terms of rTS, Kareem blows Shaq out of the water. He's a 70% free throw shooter and has the sky hook so he is the most valuable during crunch time of all the top centers. Kareem is a more active defender. He can't foul out entire frontcourts but on the other hand he has no exploitable weaknesses. Shaq's weakness in P&R defense was exploited by many teams namely the Kings and Spurs and teams resorted to Hack-a-Shaq in crunch time. In the 2000 Finals Shaq shot 38% from the line and missed a whopping 57 free throws in that series.
Per 75 Regular Season Stats: 1977 Kareem: 24.5 pts, 12.5 reb (3.0 o), 3.6 ass, 3.0 blk, 1.1 stl on 60.8 %TS (+9.7 rTS) with ? to 2000 Shaq: 28.6 pts, 13.1 reb (4.1 o), 3.7 ass, 2.9 blk, 0.5 stl on 57.8 %TS (+5.5 rTS) with 2.7 to
Per 75 Playoff Stats: 1977 Kareem: 28.4 pts, 14.6 reb (3.8 o), 3.4 ass, 2.9 blk, 1.4 stl on 64.6 %TS (+13.5 rTS) with ? to 2000 Shaq: 28.2 pts, 14.2 reb (4.7 o), 2.9 ass, 2.2 blk, 0.5 stl on 55.6 %TS (+3.3 rTS) with 2.3 to
That efficiency really jumps out at you! And given Kareem's lack of weaknesses and more active defense I don't see how he doesn't get a nod over Shaq for me. It's not a slam dunk or anything but I have more faith that peak Kareem is the better basketball player. And even though this is a peaks project not a longevity discussion, Kareem's better longevity still makes me more confident in his peak. He was a very similar player from 1974-1980 while IMO definitely peaking in 1977. The reason I pick this version of Kareem over 1971 and 1974 is that he's a lot thicker and more capable of dealing with physicality than in his Bucks' days. Unlike his early career, he weighed around 260 lbs so could also bang with big centers. And in 1979/1980 he's still the same guy offensively but has lost a little bit of motor and become a worse rebounder and also started cruising in the regular season a bit too much to be among the GOAT peaks.
Shaq's impact metrics look insane and we don't have the numbers for Kareem so it's not really an apples to apples comparison but the breakdown of their games makes me favour Kareem ever so slightly.
3. 2000 Shaquille O'Neal
Alternative Years: 2001
Nominate: 2012 Lebron James - His best playoff run.
Add me on Twitter/X - Djoker @Danko8c. I post a lot of stats.
I would like to participate in this, but I frankly don't have the time to write out such lengthy explanations for every pick in this project. I'll throw out my ballot, if it's not accepted, no big deal, I just won't participate in this project if that's what's required.
Stan wrote:I would like to participate in this, but I frankly don't have the time to write out such lengthy explanations for every pick in this project. I'll throw out my ballot, if it's not accepted, no big deal, I just won't participate in this project if that's what's required.
1. 1991 Jordan
2. 2018 LeBron
3. 1977 Kareem
The original post stipulates at least one line of reasoning for each pick. The time it took to write your first paragraph could have easily been used to satisfy that requirement. I don’t think you’re *that* busy
Stan wrote:I would like to participate in this, but I frankly don't have the time to write out such lengthy explanations for every pick in this project. I'll throw out my ballot, if it's not accepted, no big deal, I just won't participate in this project if that's what's required.
1. 1991 Jordan
2. 2018 LeBron
3. 1977 Kareem
Just quote other posts above yours which have a lot of the details to support your ranking. After the first few ballots, I doubt others will have a lot to add that hasn't already been said if they are voting for the same names.
Add me on Twitter/X - Djoker @Danko8c. I post a lot of stats.
11 championships from a natural born winner who wins no matter what. Simply the best. So he doesn’t score. But he invalidates opposing offense to an extent that on defense alone you are the greatest winner in history. And hey he didn’t always have championship tier help. But he always won. The best man defender. The best help defender. The best leader. The best winner. Lebron is a titan. But he was never inevitable like Russell.
Russell’s impact was so singular his sole defensive impact outweighed his entire teams offense and turned them from an okay team made of offensive stars to a defensive dynasty headed by one man.
Finally the kid from Akron. Chasing Jordan, but in Magic’s mold:
Over the previous years the offense goes from Kareem-centric to Magic-centric. A lot of people lament Magic not being given the reigns earlier but it’s not so easy. Prime Kareem completely invalidates high-level defense if you use him right.(and who was using him correctly…) Even now he is a huge headache for opposing teams but, you know who also invalidates high-level defense entirely? Magic. It’s easy to just look at the assists but if you go by the assists Isiah isn’t that far off. Here’s what Magic has that Isiah doesn’t. You have 5 guys there to make sure Magic or one of his teammates doesn’t score. But if there’s just a sliver of daylight. Just a few guys ever so slightly overextended…Magic might just render all 5 of those defenders moot in a flash. He has unbelievable ball control, he’s big and powerful at the basket, he uses his eyes better than anyone, and has a cannon for an arm. He can defeat your defense basically himself. He might not end the possession with a tough contested fadeaway, but he’ll do it his way. And there’s only one other guy you could ever say that about. And he isn’t going to be on anyone’s ballot until 2004.(unless you’re really into him and are a “High school LeBron was the level of an NBA All-Star” (real people that exist)) Finally, his brain. His advanced stats are ridiculous But that doesn’t tell you how someone makes his teammates better. Magic’s impact is ridiculous. Magic is the smartest player on the court every time he steps on it(yes, smarter than Bird). He knows where he needs to go and where you need to go and he’ll make sure you and him both go where you need to go at the time and place you both need to be there. And he does that better than anyone else and everyone who comes after, probably even including that 2004 guy(who’s better at a couple other things). Is his team good? Yes. Is Kareem amazing? Definitely. But we seem him still doing all this with explicitly fine and not Kareem teammates when he crosses 30
Great stats. Great tape. Undeniable impact. You play to win and no one ever makes you win like him (Russell yes). But what’s been lost to time is the pressure. Not from just being so incredibly good, but because there was a type of good many wanted him to be: https://youtu.be/mZE4NuH_uuA?t=271
One of the things that always rubbed me wrong is how people covered and still cover Lebron pre-miami. I think it's obvious for anyone who paid attention he was already one of the smartest players ever.
Yet many say things like "he didn't know how to win" (Lebron himself caved in to this one unfortunately), "he didn't know how to close", "he wasn't a game manager yet", while lambsting his almost always correct decision-making as soft, weak, or not "alpha"
And then I came across this; one of the most absurd collection of interview questions in history aimed at any basketball player from one of the most respected and, at least by reputation, class personified, Bob Costas.
We talk about what Russell and Kareem faced, but I don't know I've seen this seriously discussed with Lebron: How much did race factor into how Lebron was and still is covered. Times 100 when we speak of the part of his career before his first ring.
Many hate how he took control of his own future. How he took control of his teams. How he took control of offensive possessions. How he’s trying to take control of endless ridiculous narratives written up exclusively for him and him alone. I applaud it. Invalidating opponent defense. Controlling opponent offense. That’s on film. But entering the most negative environment almost any player has ever entered with teammates and anchors alike chomping at Hummers and Tatoos to see him fail; and forcing all of them to shut up? Chosen one indeed.
20 years old and he already has Cleveland winning despite it all. And he’s just getting started. 20 years later and he’s not even finished.[/quote]
The playmaking was mostly there already but now the other shoe drops. Ontop of making like Magic, he’s defending like Pippen even with a shaky jumper that type of combination that can make you the best player in the league. You need to think of him inside. He’s not AK47 but he will spend stretches of games on the backline and makes would be dunkers and slashers second-guess themselves and try a different path. He’s an active and disciplined man defender running 1 through 4 and occasionally even 5s. He’s a bit gambly to start the year but as the season progresses you see all the components for the two way monster he’s about to become. Poised but powerful. Disciplined but dynamic His shooting isn’t there for the final hurdle but he finds other ways to keep his team in. Tripled and quadrupled and still more often than not he finds the right man at the right spot at breakneck speed. Add in the fear he’s putting in manu and parker at his basket and you get a massively overmatched cleveland team lottery-level cast staying right there every game. They probably win a couple if Mike Brown isn’t trying to use Lebron like Jordan. Waiting and cutting in the corner where the Spurs can afford to leave one man instead of three or four while Gibson brings it up with his broken foot again and again for dinosaur offense. Or putting Gibson on Parker or tanking their offense with Snow when they have someone who can handle him nearly on his lonesome. It wasn’t an all powerful performance and there are plenty of things to work on. But for anyone who really watched there was lots to praise. And don’t get me started how he got there 27 straight vs Detroit. But that’s not the point. The Cavs got where they got on great defense and under the noses of alot of people who make it all about deflections and steals. A really great attacker became a really great defender.
…
The lazy will look at his scoring and say he was bad against Boston. They’ll ignore injuries and hapless support (not one win when he didn’t grace the court) and say he didn’t win enough. But those watching really watching will see a forward making chances out of nothing in bunches and patrolling his basket from the rim and from the key and from the paint and at the elbow making everyone from 1 to 5 on Boston think a little different about what they were going to do in possession after possession after possession. And then in the last 3 games the offense comes alive. Lebron becomes Atlas and if not for Paul pierce becoming saiyan and one of the best defenses in modernity Lebron might have went and won a title then and there with little more than a few defenders he helped make look much better than they really were. He was an all-time great already but now you see the outline of something even better, much better. With respect to Kobe and KG and the many fine players who shared the league it’s just not close. He scores with anyone and others better like anyone and can defend like anyone who isn’t pushing 7 feet inside out and in between. Just the best.
No player ever is flawless, but this is as close as anyone’s gotten to having no weaknesses. Defending inside, defending outside, helping, closing out shooters, guarding 1-4 and on occasion even 5’s, screen navigation, sealing off, Lebron’s the full package defensively. As full a package any perimeter engine gets. And on offense, the only question mark is a jump-shot, a question he answers and then some in the midst of the most impressive playoff performance of any non-giant ever. It’s not enough against the red-hot Magic and Dwight but he was incredible asked to produce more than anyone ever and almost pulling it off.
His game will improve in certain ways but this is Lebron unleashed. This is when he becomes undeniably better than Jordan. Prophecy fulfilled.
The Forgotten. Kareem.
(1974) Alternates: 1971, 1972, 1977, 1980
He was plausibly the best before entering. He was the best his first year. He could mostly neutralize defenses through power and grace. And mostly neutralize offenses with size and speed. Kareem completely invalidates high level defense and the ability for him to actually take less shots is amazing for a teams offense too. His lone weakness is his ability to navigate the middle of the floor. So he’s not Magic or Lebron. But does he need to be?
He entered the league and his Milwaukee’s wins doubled. He missed games and they completely and utterly collapsed, It’s popular to look at 1977 when he played Walton close severely undermanned and put great scoring. But I prefer the two-way invalidating near lone-man neutralizing force before the age of Abdul-Jabbar. A guy who could be in the shortlist for best defender and attacker in the league year after year and most years the title of best required no dispute. He didn’t win facing the legendary Lakers, 69 wins strong. He didn’t win against Hondo and Cousy in the final game 7 without a point guard. But he was still a giant. Even when small petty men tried mightily to drag him down.
He would win 2 MVPs after this. And 5 championships. And retire having scored more than anyone. Only to be eventually beat by the guy I have above.
Many will balk there is no Jordan here but I’m not sure he is even the best scorer. Jordan has good efficiency for his volume which is admittedly ridiculous. But Kareem has amazing efficiency for any volume and it just so happens that his volume is very high too. Kareem also puts more pressure on the defense especially in his prime because no three point line. Because he is taking exclusively value shots.
There’s also a lesser return on volume when you consider the defensive impact. Kareem could also be scoring idk 40+ a game if he wasn’t providing ATG rim protection. Rim protection and offense have trade offs when you talk about optimizing these ATG big men. Hakeem and Tim Duncan don’t have ridiculously high volume on purpose too. This is a hypothetical the “40 a game part” but yeah I’m taking center offense and center defense over guard offense and guard defense.
Djoker wrote:In terms of simple box scores, 1991 Jordan just dominates in the postseason. If we take all the 32 best runs by offensive centerpieces since the merger and compare them, it becomes abundantly clear. I listed him as #1 if only other Jordan seasons are higher.
What an interesting way to phrase "gets torched by Lebron's 09 run per rate in all numbers I like". So much so, your only real retort is arguing it doesn't count
Spoiler:
2009 Lebron is a classic case of an outlier because if that was Lebron's true peak then 2008 or 2010 must be part of Lebron's peak and neither is. Lebron in 2009 put up the best playoff stats of his career (over a mere 14-game sample) but it wasn't the best version of Lebron. If it was, the virtually identical Lebron the following year(s) would replicate it.
Jordan was either the best or one of the best at every meaningful part of the game. That he was such a transcendent scorer means that the rest pales a bit by comparison. But I’m saying right now that Jordan would probably have been an all-star even if he’d only been an average scorer. Jordan may well have been the GOAT (depending on your criteria) and this ‘89-91 may well have been the highest peak ever (by modern metrics, it probably was) but to attribute both of those things to his scoring is to completely miss the sheer breadth of his excellence.
Playoffs Per 75
2006 Lebron: 27.8/7.3/5.3 on +2.1 rTS with 4.5 to (13 games) 2007 Lebron: 23.6/7.6/7.5 on -2.5 rTS with 3.1 to (20 games) 2008 Lebron: 27.8/7.7/7.5 on -1.5 rTS with 4.1 to (13 games) 2009 Lebron: 35.6/9.2/7.4 on +7.4 rTS with 2.8 to (14 games) ---> OUTLIER 2010 Lebron: 27.1/8.6/7.1 on +6.4 rTS with 3.5 to (11 games) 2011 Lebron: 22.5/8.0/5.6 on +2.2 rTS with 3.0 to (21 games) 2012 Lebron: 29.0/9.3/5.4 on +4.9 rTS with 3.4 to (23 games) 2013 Lebron: 25.6/8.3/6.5 on +5.0 rTS with 3.0 to (23 games) 2014 Lebron: 30.0/7.7/5.2 on +12.7 rTS with 3.4 to (20 games) 2015 Lebron: 28.3/10.7/8.0 on -4.7 rTS with 3.8 to (20 games) 2016 Lebron: 26.7/9.7/7.7 on +4.4 rTS with 3.6 to (21 games) 2017 Lebron: 29.6/8.3/7.1 on +9.7 rTS with 3.6 to (18 games) 2018 Lebron: 31.9/8.6/8.5 on +6.4 rTS with 4.0 to (22 games) 2020 Lebron: 28.2/11.0/8.9 on +8.2 rTS with 4.1 to (21 games) 2021 Lebron: 24.0/7.4/8.3 on -0.7 rTS with 4.3 to (6 games) 2023 Lebron: 23.3/9.4/6.2 on +0.3 rTS with 2.4 to (16 games)
As we can see here, 2009 Lebron is a clear statistical outlier.
Compared to surrounding years he's averaging an extra 8 pts/75 on better efficiency while turning the ball over much less.
Even his second best postseason statistically which is 2018 is still almost 4 pts/75 less with slight worse efficiency and a worse assist to turnover ratio
Ignoring of course Lebron was en-route to a better year (by common box-score) next season before he injured his elbow
Spoiler:
I know I haven't really participated in any discussion prior to this, but I want to chime in here. Why indeed, is 2010 Lebron not being included? If this is a comparison of peaks and its been clear that we're trying to go beyond something as simple as just a "most successful season" list, then why exclude what might just be Lebron at his absolute best (IMO his strongest regular season), even if the playoffs were underwhelming. Allow me to present the case.
The Cavaliers finish with a 61-21 record and a 6.19 SRS, both down from the previous year, though it should be noted that the roster was riddled with absences and injuries throughout the season. Williams plays 69 games as opposed to 81, West misses 20 games in the early season, Shaq misses 29 games and posed further issues by never fitting into Cleveland's offensive system very well (of the 10 best offensive lineups Cleveland ran that year with >40MP, Shaq was in one of them), Gibson played 19 fewer games than the year before, Ilgauskas/Jamison trade caused chemistry issues with Jamison struggling particularly to fit in on the defensive end (and randomly dropping off to a 50% FT shooter after shooting 70% in WAS an shooting 73% for his career), Kuester leaving as the head offensive coach, etc.
Despite all this, they managed to go 60-16 in the 76 games that James played (he missed 4 games at the end, which Brown at the time attributed to lingering issues but later claimed was due to his elbow, both of which, could be given as an explanation for his relatively inconsistent performance in the last month or so of the regular season), and using ElGee's In/Out method, were roughly a 6.89 SRS team in the 76 games James played in, putting up an ORTG of 111.8 (#3 in the league, +4.2). On the other hand, they went 1-5 in the 6 games they played without him (close win against the Spurs at home, 1 close loss against ORL at the dead end of the season, the other 4 were very winnable games, and its not unreasonable to suggest that they would have won 65-66 again had Lebron played, which would be a slight overperformance based on their +7 SRS w/Lebron), put up a -2.95 SRS in those 6 games and an ORTG of 103.6 (-4.0).
Taking a further look at just the offense, with James ON Court:
2009: 116.4 (+8.1, #1) 2010: 116.6 (+9.0, #1)
So despite the drop overall, Cleveland's offense with James on the floor is even more impressive than the previous year, which his ORAPM seems to support (+7.1). Let's take it further and compare the performance against top 5 defensive teams (Orlando, Boston, Houston, San Antonio in 2009 and Charlotte, Milwaukee, Orlando, Los Angeles, and Boston in 2010) excluding any games James didn't play in (and one game against Boston in which Garnett did not play).
2009: 106.5 (-1.8 LA, #24) against an expected DRTG of 102.9 (+3.6) 2010: 108.8 (+1.2 LA, #11) against an expected DRTG of 103.3 (+5.5)
So what I see here is a Lebron who's running an offense even better than the year before, despite having less/weaker talent to work with. The roster was frequently changing around him, he was asked to play far more roles in various lineups and he managed to adjust and perform better than he had before.
The most evident example of this, of course, was the extended stretch at the end of January 2010 and through February 2010 where Williams missed significant time and Lebron was thrust into the De-Facto PG position. Looking purely from a box-score perspective, over this 11 game stretch James put up 31.0/6.6/10.5 on 61.8% TS with 3.8 TO. Taking it further, Cleveland posted a 115.5 ORTG (+7.9 LA) over this period, which would be tied with Nash's Suns for the best offense in the league. So not only is he able to take on the larger scoring load and creation load due to the loss of the team's secondary ball handler and playmaker, he's able to do so while effectively IMPROVING the offense and while IMPROVING his own efficiency.
Getting into the box-score, James' individual numbers look better: 30/7/9 on 60% TS (+7.1 ORAPM, +2.6 DRAPM, +9.8 overall) in 2010 vs 28/8/7 on 59% TS (+6.6 ORAPM, +2.8 DRAPM, +9.3 overall) in 2009. Prior to the mid-late March injury (whatever caused him to miss the 4 games at the end of the season), even his PER was higher than the 31.1 he finished with, somewhere above 32.0 which would be ahead of his 31.7 from 2009. I don't like putting much stock into "clutch" numbers, but I know colts has been stressing those in his posts for 2009, so again 66/16/8 on 63% TS (+37 overall) in 2010 vs 56/14/13 on 69% TS (+45 overall) in 2009.
So with all that in mind, I just don't see how Lebron's 2009 regular season at least could be considered superior to his 2010 regular season. While the 09 Cavs certainly maintained a consistently higher level of play, it seems that the 2010 Cavs were dropping off to a much lower level when James was off the floor, and thus even a greater level of lift from him would not propel their numbers to match 2009 overall (thought they were arguably even better with him on the court).
Now, the playoffs is where it gets a bit tricky. As far as I can tell, his first-round Chicago series was superior to what we saw against Detroit and Atlanta the year before (all average to above-average defensive teams) and this is DESPITE him playing far more inconsistently than usual (the elbow issue had already popped up in games 1 and 4, before the left handed free throw fiasco in game 5). Evidence, 22/8/7 on 53% TS in Games 1 and 5, 39/10/9 on 74% TS in Games 2-4. Watching that series again, in Game 5 I saw a Lebron who lacked full game aggression and exhibited a certain passivity that we saw again later in the Boston series. Again, evidence, after maintaining a 32% USG in the first four games, he puts up a USG of only 23.9%, taking only 12 shots, in a close game Game 5 no less. What would be the reasoning for that? Certainly after putting up 35/9/8 in the first 4 games it's not that he's not skilled enough to take on the defense. Nor is this Chicago team posing enough of a threat for him to give up, or lock himself out of the game due to not being mentally strong enough to handle the adversity. Is it really that far-fetched to believe that he could have been injured, and that this injury was one that could show up and affect his play one day and then not cause much of a problem another day?
There's documented evidence that his outside shooting showed somewhat of a correlation to how many rest days he had, specifically in the last month or so of the season and the playoffs. The elbow issue that he claimed to have would be something that effected exactly that, long distance shooting, so why is it so much more likely that he choked or seized up mentally or just wasn't skilled enough to cope with the tough playoff defenses, defenses that he was able to tear apart that very year?
So let's move on the to Celtics series. He plays great in Games 1 and 3, putting up 37/8/7 on 67% TS. Both games are in line with how he performed vs. Boston in the regular season (37/7/8 on 57% TS). Also, notably, BOTH games came after 3 days of rest and both were the result of strong outside shooting performances from him (barometer - 16/20 FT 80%). On the other hand, in the 4 losses, he put up 22/10/7 on 49% TS. All four were far worse outside shooting performances (barometer - 36/50 FT 72%) and un-coincidentally, all four came after only a SINGLE day of rest, as opposed to the 3 days he had before the good games. Looks like a pattern to me, one that could be easily explained by an injury that would very clearly hamper a jumpshot.
So at the end, it comes down to that postseason performance. The regular season, to me, clearly suggests that he was at a level above his previous 09 level, and the playoffs looked like they would have been the same story had it not been for the slip ups. I suppose at that point, it comes down to what you're willing to attribute the struggles to. If the faltering is attributed to the idea that he was a fundamentally flawed player who got exposed by an elite defense OR that he just had a mental breakdown in the face of adversity, then yeah, I can't really pick this season as his best one. But if you're willing to consider that he was actually hampered by injury, I think its perfectly reasonable to believe that he was better and more impactful in 2010 and 2009, and in that case I'm willing to pick 2010 as his peak year with confidence.
Djoker wrote:GOAT-level defender for a primeter player; he doesn't touch bigs in defensive impact but his numbers relative to perimeter players is top percentile