Anthony davis
OH MY GOD THANK GOD I SAVED THIS THE BOARD ATE MY POST UP LOL
Remember, we are talking about the
players peak ability not merely his
impactI only have around 3/4s of it done. defensively, he does need some work, but the system is a reason. he isnt trancendant defensively but in the right defensive system, I feel his is a top 10 defender easily.
- Offense
Davis was underutilized on offense. It was downright insulting in my opinion.
Firstly, lets focus on his gravity.
The pelicans system was one that, for some reason, preferred to have contested midrange jumpers than open 3 pointers.
for my source, ill be using this article.
http://regressing.deadspin.com/how-anthony-davis-gives-the-pelicans-open-looks-they-do-1690381244Generally, for obvious reasons, there is a huge correlation between having open shots, and ball movement (touch time).
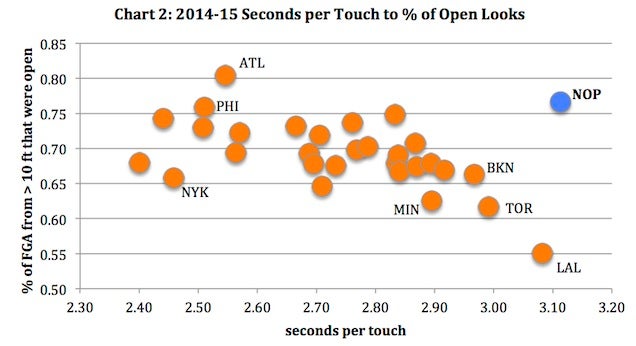
the team that gets teh 2nd most open shots in the nba is the pelicans.
they were also the team with the worst ball movement.
there are outliers, but the pelicans are a ridiculous outlier, in this case.
this applies to all of their shot attempts.
http://i.kinja-img.com/gawker-media/image/upload/s--MUn0a6H5--/ujhkh4jlsf6ftyvvqhqh.jpg
and these are the players that get open shots.
http://i.kinja-img.com/gawker-media/image/upload/s--cjeAjn0h--/sreno12xhhqgaqaujn3t.jpg
so first of all, Davis is open around the league average, in terms of shots. (open 72% of the time, compared to 69% of the time for the league average)
now, one would think that this might be a bad thing, but obviously, this is more due to the matchup disadvantage Davis is. he can get open through great off-ball movement, and obviously, he is a threat from everywhere except from from the 3 point line (well, he is now).
but look at 3 3 point specialists.
a premier (possibly former premier) stretch four in anderson
Luke babbit, who shot 50% from 3, and really couldnt do anything else last year.
eric gordan, who was 2nd in the league in 3 point percentage last year.
they were all open between 80-85% of the time.
now, I cant explain this as well as the article does, so Ill quote it here
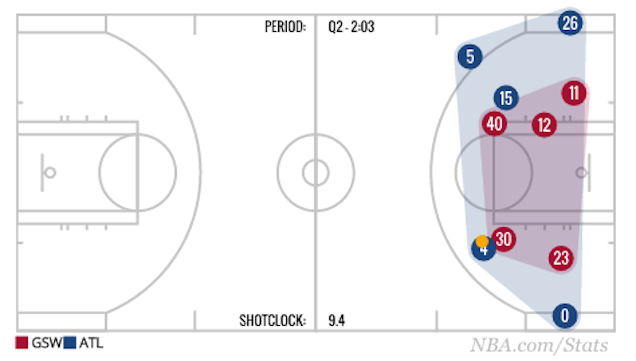
Notice that in Image 5, the paint is wide-open. The Warriors are not showing much help defense from the weak side. This defensive formation is inviting Paul Millsap to drive.
There are a number of factors that must be considered when trying to determine the optimal position for a weak side defender. With the above example, the Golden State defenders must be weighing Millsap's driving ability. According to NBA.com's player tracking stats, Millsap is shooting 45.1 percent on drives this season. They must also consider the defensive ability of the player guarding Millsap. In this case, that is Steph Curry (#30). Curry had just switched with Draymond Green (#23) on a screen. Draymond Green would have been the preferred defender of Millsap for Golden State.
But a possession is a fluid thing, with defenders making on-the-fly decisions about not just whether or not to help or switch, but their resting defensive position on the floor—do you cheat a half-step closer to the lane because of Millsap's ability to put it on the floor, or do you stay wide and guard the three-point line—and all of this is informed by the specific strengths of your opponents. On this one, Millsap, who shoots 46 percent on drives, drove the lane and when defenders not covering Kyle Korver slid down to help, Millsap kicked the ball out to Teague for an open perimeter shot (he missed). This is the anatomy of a typical open shot; a player forces the defense to make a decision, and hopefully does it fast and well enough to create an opening for a good shot. But some players create bigger openings than others.
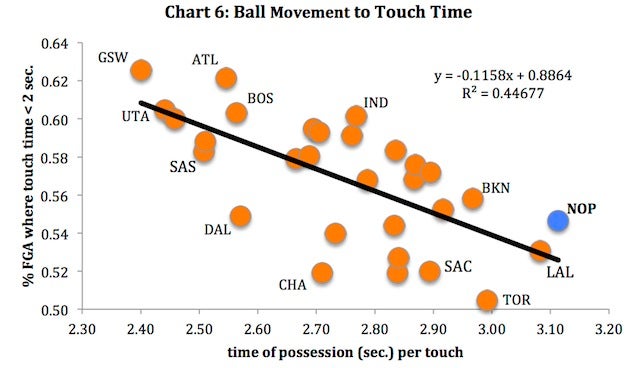
this is a graph representing touch time before the ball handler takes the shot. for obvious reasons, the less touch time should mean a open look (catch and shoot).
the pelicans do not fall in this category.
think about Davis in a matchup sense. he is argueably the most athletic player, considering his size, in the nba (most people seem to agree in the gm thread).
he shot 40+ percent on jumpers (44% I recall).
if a powerforward or center closes out hard, he drives by and will go at the rim, where he shoots 73%.
overall, his open shots are probably not a result of the system, they are more the result of him being already among the biggest mismatches in nba history
When Davis is taken out of the equation, 64 percent of the remaining Pelicans' 2-point attempts (from > 10ft) are open. That number is still above league average, but far closer to reasonable given the teams' low ball movement.
so it does seem like 2 pointers are based on davis being a mismatch.
What about 3 pointers?
this is where gravity kicks in.
once again, three 3 point specialists, with 1 coming off a major injury, the other not being so athletic (babbit) get a ridiculous amount of open shots.
90+% of eric gordans 3 pointers have been openthe pelicans offense has many possessions where davis gets the ball at around the elbow, or at the foul line (he gets 7 touches a game in those locations)
in this position, he has a variety of options. play him tight, he drives by for a dunk. play him loose, and he knocks down the mid range jumper.
if the defense helps, he can pass it.
http://i.kinja-img.com/gawker-media/image/upload/s--ImMpo8vH--/xhomwycptwcbap0cdgct.png
I realize davis is a bigger threat than the hawks, but this is ridiculous.
It's as if the rim is a special treat to be saved for a later feast, and Davis is Vacu-Sealing the defenders. Above, we talked about the many factors influencing the optimal position for help defense. Apparently, Anthony Davis with the ball in the center of the half court trumps all.
now, the article will explain how this next play described by this image went out
The effectiveness of these plays might lead you to wonder why the Pelicans are scrapping it out for the last playoff spot in the West, at least beyond the cosmic imbalance of conferences. Well, it turns out that while Anthony Davis has super powers, and those can affect a lot of good on an offense, just as often the New Orleans offense itself uses those powers for, uhm, it might be easier to just show you.
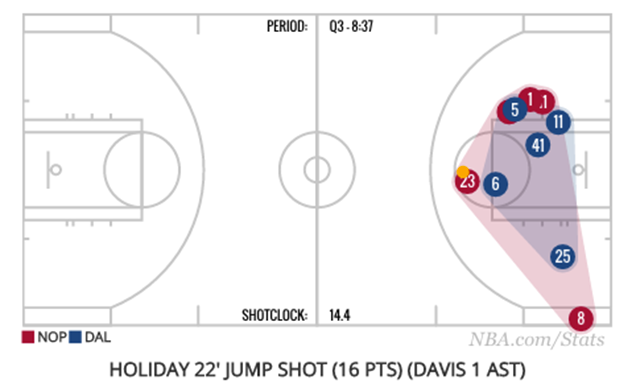
In the play below, Davis has the ball at the foul line with over 14 seconds on the shot clock. That's a great start. Luke Babbitt (who is shooting 50.9 percent on 3s for the season) is waiting in the corner. It would be foolish for Babbitt's defender to leave Luke wide open for a corner 3. So, Davis will have one less help defender to worry about should he decide to drive. The play looks fantastic so far. Half the court is set up perfectly. The other half…not so much. 3 Pelicans are grouped on the edge of the paint. This brings 3 defenders to a position where they can both guard their man and help on an AD drive. So what was the plan? Two of those 3 in the huddle set a screen for the third (Jrue Holiday). Then, Davis dribbled over for a dribble-handoff to Jrue. All of this was to get Holiday a 22-foot 2-point jumper.
Let's go through that again. New Orleans got Anthony Davis, one of the great players in the NBA, the ball in an incredibly dangerous spot with plenty of time on the shot clock. Then, they exploited this fortuitous position by running a play for a Jrue Holliday 22-foot 2-pointer. Holliday shoots about 36 percent from that area on the court. That's a play where the first option was a shot that generates .72 points per possession. In this case, Holiday made the shot, but still.
So that's about the size of it. The Pelicans are a unique team built around a unique player, and as often as that turns out for the best, they just as often put his unique skills to uniquely stupid use. Anthony Davis might well be unstoppable. But someone's really got to stop the Pelicans.
so, offensively he is underutilized.
Monty did not emphasize that davis should pass it to the open man in the perimeter.lets look at the pelicans after the milwakee game, when he started "passing it" more
over 16 games, lets look at Davis's passing stats.
3.8 assists. 1.4 turnoversassists% 18.3%
turnover rate. 6.1%
in the 16 games davis played, the pelicans had roughly a 111 offensive rating.
despite most games being without Anderson and Jrue.
Not only that, but the reason he might have not had such a ridiculous "impact" is because of Tyreke evans.
statistically, the net rating between tyreke and davis were the 2nd worst.
mins off rtg def rtg net
Anthony Davis - Ryan Anderson 1201 113.4 107.4 +6.0
Anthony Davis - Jrue Holiday 1861 108.6 103.6 +5.0
Anthony Davis - Omer Asik 1321 105.1 100.5 +4.6
Anthony Davis - Tyreke Evans 3070 107.5 105.8 +1.7
Anthony Davis - Eric Gordon 2899 107.0 107.2 -0.2
Tyreke evans had more isolation possessions last year than westbrook.so in 16 games davis played, 8 without ryan anderson, and 12 without holiday (and really, holiday was never at 100%), and with pondexter (starting sf) putting off surgury, that has him still sidelined right now, the pelicans posted an offensive rating good for 5th in the league. 3rd in the west.
And by the way, in the 16 games with Davis passing, the pelicans shot 42% from the 3 point line.
so, as a passer, he is underrated. and these werent just easy passes too.
i will be referencing passes I saw on an article.
https://youtu.be/JyQPgKrTht8?t=14sthis pass might have looked easy, but it took great instinct to realize that the defender would go towards hiim right when he cought the ball, and quickly pass it to the 3 pnt shooter in the corner before the defense could react
https://youtu.be/JyQPgKrTht8?t=2m53sonce again, this is an easy pass. however, thats not important, because we are looking at his p
assing instincthe got his back towards the basket, faked an aggressive backdown, and passed it to the open man. look closely. he never even looked at the rim. he planned this all along. (also, it was a pass out of the pick and roll... so now how do you defend it?)
http://on.nba.com/19eb58Uknowing the defense will rotate on his great mid range shot, regardless of his size, he surveys the floor quickly, using his 6ft 11 - 7ft frame, and passes to cole for the open 3.
http://on.nba.com/1OUqrkscole missed the layup, but look at the situation
davis has 2 options. the shot clock is at 6. he can force a jumper, or pass it to cole, threading the needle, as 1 defender is coming at him, cole is cutting.
he throws a great pass.
http://on.nba.com/19eb58Uill let the article explain on this play.
None of these passes impress me as much as this sequence from Davis. It starts with the patience to not force a pass to a cutting Norris Cole on this post-up of Thad Young. Davis realizes he has time and that Cole wouldn’t be able to do anything even if he catches the ball and so he holds on to the ball while Cole clears out of the lane.
Next Davis holds the ball out far from his body and looks around the floor, drawing the attention of the Nets defense, specifically Joe Johnson. With that happening, Dante Cunningham makes a flash to the basket and Davis sees it as it happens.
Again Davis will have a tight window on this pass and he knows that. The window will actually be so tight that Davis will have to start throwing this pass before Dante Cunningham is even clear of Joe Johnson. For most big men that isn’t a pass that they are willing or able to make. For Davis it is made look easy. Here he is starting to throw the pass before Cunningham is actually open:
The final part of the play is the placement of the pass. Davis has to get this ball past his Young who is his defender, past Johnson who is finally reacting to the Cunningham cut and in front of Deron Williams and the other Nets defender on the baseline. It has to be perfectly timed and placed for the play to work. Davis does just that.
Cunningham is able to catch the pass and continue his cut all the way across the lane for a layup. It is a completely unguardable pass from Davis and one that not many people can make.
It is also the final example of the growth of Davis as it brings each and every aspect of passing into one play which is the encouraging part. Davis may not ever put up season long huge assist numbers but he is now flashing skills that make him impossible to figure out. He can pass out of the post, read defensive rotations, catch and pass out of the pick-and-roll and pass into tight spaces.
so offensively, when he was finally,
starting to be correctly utilized, the pelicans, without 2 of their 3 best offensive players, and with 2 of their 6 other best offensive players playing on injury (pondexter and sorta evans)
they had an offensive rating of about 111.
btw, in the 2 games without davis in this sample, they had a sub 95 offensive rating.
playoffs
ill be brief
in the playoffs, they did not utilize his passing correctly.
nevertheless, while his numbers may have slightly overstated his impact, he
defended the rim very well, held opponents to 33%,
which is better than gobertand the pelicans, with jrue playing hobbled, pondexter playing through injury, and reke either playing through injury or going "bruh im tyreke evans" mode (game 3 4th quarter) and monty being, well, monty, and the warriors having a 101 defensive rating, you would expect our offense to be, well, around 104, based on the season average and how good teh warriors defense was.
well, it was 107.7.
taking into account league averages, that would be good for around a 109.5 offensive rating in the regular season
However, contrary to popular belief, their defense was better in the playoffs than in the regular season, discounting the pelicans.
against houstan, they held them to a 102.4 offensive rating.
against memphis, they held them to a 98 offensive rating
both of these teams are better than league average, especially houstan.
and the pelicans had a 107.7 offensive rating.
extending beyond that, davis really only had good games in games 1, 3, and 4, and he only really had a good game at the end of game 1.
in the last 2 games against the warriors, the pelicans had a 116 offensive ratingso in the games that davis played well, offensively, he generally performed pretty well.
also, the idea that draymond stopped him, or even limited him, is completely false.
as for the idea that he relied on his teammates, or that if he wasnt assisted, he couldnt scorefirst of all, who cares? he still scores lol.
second of all, if the idea is that you cant go to him in the clutch...
Well, technically, Davis, in 177 isolations (which is a fairly large amount for a big man, Cousins had 246) He was in the 78th percentile in terms of his ability to score off isolations. A little bit better than lebron, who was at 75th percentile
His assist rate is a result of how quickly he attacks. watching footage, it really seems like even when he isos, he literally starts his attack right after he gets the ball, as in, there is literally absolutely no delay, meaning an assist would have counted. unfair, but its true. Also,
Not saying he was better than lebron at isos, but he definately was effective.
Davis scored 0.1 more ppp than Cousins, 0.01 more ppp than steph (who had less possessions), 0.07 more ppp than Aldridge(who had less possessions), 0.35 better than Duncan, 0.01 more than Kawhi, etc. (all other than cousins had less possessions)
He definately wasnt someone who coulnt be a go-to guy.
in terms of going to him at the end of the game, he shot 60 fga with the clock at 5 minutes or less, with the score being in the 5 area, which is generally seen as clutch time.
He shot 61.7%. and 60fg is a sizable amount, and most people actually get mad at tyreke because he actually does try to "take the glory" away from davis.
only 10 of these were dunks. 1 was a tip shot 67% assisted
he was 26 of 49 on jump shots, hooks, and layups.
Bring this down to 1 minute, and he was 11 of 16. 45% assisted
According to some lineup stats, in terms of helping the team, Lineups with Davis and Tyreke on the floor were actually the worst team wise, and Jrue was injured.
He averaged
23.7-11.6 on 56.5%
Without Tyreke
small sample size. but still.
he made more than anyone on his team, including Evans, who I read somewhere was one of the leaders in fg attempts, though he sucked at it.
Bring this down to trailing by 3 or fewer and he made 3 of 3, 1 assisted, in the last minute.
in the last 5 minutes, he made 9 of 14, 55% assisted.
he is 9/12 when tied, 55% assisted, last 5 minutes
4/5 when tied in the last minute, 20% assisted.
I had this cool website before, but I cannot find it sadly.
it had all the one on one matchups in the nba. i swear, in the playoffs, I am sure he had a great shot record with green as the closest defender, other than game 2.
Im pretty sure it was the same with bogut as well.
Team offensehttp://www.thebirdwrites.com/2015/5/28/8670879/2015-pelicans-offense-monty-wrong-playsthe pelicans ran the wrong plays.
look at the article, to understand what im gonna say next.
Now, understand, I made this for the pelicans forum. therefore, this wont be centered on Davis. you can skip this whole section
but its to show that it would have been hard for davis to impact games, even though he already did, because the pelicans offense was just in shambles.
http://www.pelicansreport.com/showthread.php?84877-My-take-on-how-Gentry-will-help-the-offense-Also-an-idea-for-a-new-statisticIll put it in a quotation so you can skip it easily.
You guys have probably already seen this before, but take a look at the graph that shows the plays.
I dont have time to make a graph (I have a 30 minute time limit to type this since im in a hotel)
so Ill just show what I did
Basically, I noticed that it seems like there are some glitches with synergy stats... adding all the frequencies of the plays together dont equal 100% (i tested multiple times with golden state)
With this in mind, I got the points per possession on each play, multiplied it by the frequency, and added them all up (basically, for the pelicans, it would be 1.22 x 8 + 1.02 x 4.4 + 0.85 3.8 etc..., and take the sum and divide it by 8+4.4+... think about PEMDAS) to get a "points per play" guide. its not really transferable to offensive rating, but it did show a good correlation with offensive rating rankings.
and what I did is I basically made a points per play guide, and multiplied it by 100 to make it look good, I also got stats for putbacks for another list
I did this for every team to ensure accuracy, but it might not be 100% accurately calculated. the % left is the percent of remaining plays that are misc. the nba stats site doesent seem to add them up correctly.
with that in mind, here were the many rankings. think of this as a full average points per play run. I double checked most of them, but a few numbers might be off by a bit. It showed a strong enough correlation with offensive rating though, strong enough to make a guestimate for the pelicans offense next year
originally, I only used the data in the chart, and forgot about putbacks.
(after adding the numbers up, I divided the total by the sum of each play's frequency)
why did I do this? so I can get to see where we would rank if we ran a similar playstyle as the warriors
anyway, this is the one where I left out about putbacks
The number that is left out is the frequency of plays run that do not fit into the 4 categories. the more left out, the worse
For example, the Cavs are ranked really low, but onnly 7.9% of their plays dont fit into these categories, so they deffinately beat out the spurs and the mavs.
Im going to make it that
LAC - 103.8844765 16.9 left out
GSW 102.7374302 10.5 left out
Tor 100.0841232 15.6 left out
Mavs 99.5734767 16.3 left out
Spurs 99.23136819 10.1 left out
Cavs 99.17263844 7.9 left out
Hawks 98.912803353 9.4 left out
Por 97.74884259 13.6 left out
NO this year 96.93935791 15.9 left out
It does seem a bit unrealistic though. it has a correlation with offensive rating though. I did leave out putback plays intentionally though, since we cant control the frequency when we run these plays
The mavs have too much left out, and overall, factoring in the plays left out, I would rank it as
LAC - 1
GSW - 2
Tor - 3
Cavs - 4
Spurs - 5
Hawks - 6
Mavs - 7
Portland - 8
Us - 9
so the mavs are definately too low.
Im pretty sure I calculated us this year wrong, but the order does seem decent, and the point was to show that this is a decent way to find offensive rating
Why did I do this? I Did this so I could see around where we ranked if we ran our plays like Golden state did, because that's where gentry played
I don't have the play frequency stats for his suns years, which would have been REALLY helpful for this
But he played a strong part in the warriors offense, so Ill just use that as a guideline
So this is my guesstimate for the frequency of plays we ran. Ill explain them
I mostly just averaged it out
As a note, I Did NOT make every change beneficial for our team. I made it so we had a strong Correlation with Golden state, while still using common sense (for example, the pick and roll: roll man play frequency was decreased, but not to the same extent as the warriors played it) I changed the points per possession for the plays a bit too. I WILL REVEAL THIS AT THE END
The CUT
- The warriors ran this play 9.6% of the time. We ran it 8% of the time. from the few clips I've seen, this is a staple for a gentry led offense. I plugged in 9% as the amount of times we ran this play, more than before, but not ridiculously so. We will probably run this play more
The Screen
- We ran this play 4.4% of the time. The warriors ran this play 8.8% of the time. While we were better than the warriors at this particular play, I made it so we ran this play 7.5% of the time. An increase, but not more than the warriors. We probably will run this play more
Hand off
- Kept this the same. It will probably go down since we werent good at this play, but meh. 3.8%
Spot up
- We were suprisingly ineffective at this kind of play. Once again, I basically averaged it out, leaning toward golden state
We ran this play 19.2% of the time, while they ran it 17.4% of the time. For simplicity, I made it so we ran this 18% of the time. This will probably be lower
Roll - Roll man
- Obviously, we were one of the best in the nba at this, because of Davis. They ran ths play 6.5% of the time, while we ran it 8.3% of the time I put it as 7.8, which is probably too low. There is a VERY good chance that we run this play more like 8.5% of the time, but im just plugging it in as 7.8, since im simply "pushing" the frequencies to match golden state more
Iso
- the dreaded Iso play. we ran thi 10.6% of the time, and they ran this 6.3% of the time, I made us run it 11% of the time. Just Kidding, I made us run it 6.6% of the time. Considering how ineffecient we are at this, gentry will probably make us do this less
Transition
- We ran this 11.9% of the time, and they ran this 18.3% of the time. Obviously, our team is built to run, especially since they all lost so much weight, so us exceeding the warriors on this play is definitely possible. However, I made us run this play 17.2% of the time We will probably run this play more
Post up
- This is the only play where I didn't keep it in the range with the warriors as an example, because Gentry directly said that Davis is working on posting up more, and he implied that Davis will post up more in the interview with the Starters after the summer league game that we lost against the suns, though it might have been the one before
We will probably run this play more, but I plugged in 6% as the frequency here, though we will probablly run this more
Pick and Roll Ball Handler
- quick edit, forgot to write this, I cant remember what I plugged in, but I definately did plug something in and it was within teh range. I didnt forget to calculate it, I only forgot to type it in
I made us run this play 6 % of the time, even though there is a really good chance that we actually run this more than that
so they ran it 5.9% of the time, and we ran this 5.4%
plugging the stats in, our PPP stat was
99.74215247, With 10.7 remaining.
Thats good for 4th or 5th in the league acccording to my calculations
Obviously, this isnt a full proof stat, and the calculations might not be perfect, but whats important here is that there is a strong correlation with offensive rating
And we can see that if we ran certain plays with better frequency, we would have been a top 5 level offense.
Now, I did this again a few minutes ago, plugging in the putback stats as well
once again, the word left is bad (the more left, the worse, since now its misc)
also, there might be a few numbers wrong here and there, but for the most part I think its accurate (I calculated this on mobile, so i had to go back and forth alot, thank god i was in teh plane, i lost 7 hours lol)
Clippers 104.21843 12.1 left
Warriors 102.8105263 5 left
Raptors 101.0364238 9.4 left
Mavs 100.4438138 11.9 left
Pels with warrior frequency 99.96952308 with 4 remaining
Spurs 99.43450479 6.1 left
Por 99.37350706 7.9 left
Hawks 99.26935313 5.7 left
Cavs 98.89117043 `2.6 left
Pelicans this year 97.38656388 9.2 left (im pretty sure I made a mistake with us, out of all people)
There was definately an error while I was calculating this, so the amount left might not be perfectly accurate, though I might be wrong about there being a glitcch with synergy, so just plug in the numbers from nbastats if that is indeed the case
Now, considering all factors, with this, I would rank it as this (I set that x left is equal to 0.13 and 0.2 for 2 seperate lists, so an offense with a 100 rating an 10 left would be equal to an offense with a 103 rating and 0 left, and 110 with 0 left. This is in comparison, So you subtract a remainder of 1 team by the remainder of the other team, and the team with the less, remaining, add it by the result of the subtraction multiplied by 0.2.
For example, the Cavs and the Hawks would be, [(5.7-2.6) x 0.2)] + 98.89)
Using 0.13 as the remainder
1 - Clippers (0.55)
2 - Warriors (0.45)
3 - Raptors (0.48)
4 - Mavs (0.56) (Pelicans with adjusted play frequency and ppp for next year would be here)
5 - Spurs (0.48)
6 - Cavs (0.53)
7 - Hawks (0.67)
8 - Portland (0.45)
9- Pelicans this year (0.48)
With the 0.2 calculation it was
1 - Warriors
2 - Clippers
3 - Raptors (This is where the Pelicans would be while running plays with teh same frequency as Golden State)
4 - Cavs
5 - Spurs
6 - Mavs
7 - Hawks
8 - Portland
9 - Pelicans this year
In both examples, only 1 team looks out of place. But here is whats important. Do you see the numbers in parenthesis in the first list? thats the points per misc play. Adjusting that with the amount left over, in a certain formula that I dont have, I would estimate could make the list identical to an offensive rating chart. (the bigger the decimal, the better in that case) However, even without it, the list is, in my opinion, a way to represent how good teams were, without looking at Misc, which is more of a luck kind of stat. I believe that the 0.2 calculated list is better than the first one. For example, the Mavs were very lucky in Misc plays, without them, they would not be a top 5 offense according to this list. This is important because the list generally sets a constant for the misc plays, since they are completely random. basically, it is a, in my opinion, representation of how good teams were at playing basketball, not at how well they fared on certain plays (for example, the clippers had a higher offensive rating than the warriors, but they were MUCH better in "lucky" plays) lucky plays are the misc plays btw
the number of times teams had this "lucky play" were also big factors that leave me to believe the 2nd list is more accurate. the Hawks were very good in these "lucky plays" but didnt run it enough for them to be considered "lucky" if that makes sense.
IMO, the spurs offense was definately more consistent than the hawks offense, overall, despite them having the same offensive rating
Also, according to this, the mavs offense was "lucky" as well
So, other than frequency, what did I change for the pelicans. To make them a top 3 offense, I must have made incredibly stupid, out of this world upgrades to each ppp for each play type right?
Well, the changes I made are givens in My opinion, though some might find 1 of them too extreme
I made our transition ppp go from 1.09 to 1.14, mostly because all our guys are getting skinner and Davis will attack more in transition. Realistically this number should go up more TBH
and I made our post up ppp go from 0.89 to 0.9, though it will probably be higher because Anderson will be healthy
Thats it. I did not tough anything else.
Overall, I added 0.06 ppp combined
So JUST by changing the frequency of our plays, and making davis attack more in transition (bringing our transition ppp up), we could have a top 5 offense in the nba.
Keep in mind that the ppp stats are influenced heavily by Austin rivers playing in the 1st half of the season. Also, Davis will no doubt improve in the pick and roll, and in the post up (an extra few games from Anderson would probably bring it up to much higher than 0.9 points per post up)
And also, I kept most of the "frequencies" in a range with the warriors. I did not make it suitable for hte pelicans themselves. Obviously, When gentry is with the pelicans, He will make the playstyle, FIT the pelicans, instead of Fitting golden state. If the golden state offense is tweaked to fit the pelicans offense, frequency wise, then Im sure that we would challange Golden state and the Clippers
The stats that I made up are more to use as a guideline, so this is an estimate, but it had a good correlation with the offensive rating system when I used certain variables for the remainder
And consider, that this is literally with gentry ONLY changing our plays (it also doesent track davis's improvement next year)
now, add to the fact that many of our players are improving, and that these ppp could improve steadily, and the pelicans could be a dominant force.
My estimate for erman was he would make us a top 10 defense (around a 101.5 rating, though I think we will star off bad)
And thats without tracking Davis's improvement, and our player's individual improvements from getting faster
My estimate for gentry is that he will make us a top 5 offense (around a 107.5 rating)
And thats if no one improves individually, and if the plays he runs are the same level as the plays monty runs (monty did run some pretty good plays though)
Keep in mind, these estimates, both on defense and offense, are made with last years squad. As in, with 100+ games missed from all our starters when added together.
And thats a net rating of 6!
Teams with a higher net rating than 6 this year
Golden state 11.5 (seriously, screw them)
Spurs 6.6
Clippers 6.8
realistically, the only team to be added to this list next year is cleveland, and possibly us.
And consider that the clippers, the Spurs, and Golden state were probably the best teams int eh west last year, judging from the playoffs (for the clippers, their entire team chocked, for the spurs, kawhi chocked)
I would also like to note that in the playoffs, all teams got worse at "frequency effeciency" (if you know what I mean) due to bad defense,
but while even the warriors did worse at managing frequency, with us, it was literally like we were trying to have a bad offense
put it this way
we scored 0.7 ppp on isolation plays in the playoffs. we ran this play 14.9% of the time. To put this in perspective, according to the graph, the minimum of points per possesion in isolation plays is 0.78 ppp, and the only team we had less isos than frequency wise were the cavs... who literally only ran isolation plays in the playoffs.
Transition plays are probably the 2nd or 3rd best way to get points
we ran in transition with a 9.8 frequency, which was less than the spurs (who make an effort not to run in transition) and the grizzlies (self explanitory)
Pu tit htis way, the league average is 13%. in the generally slower paced playoffs, it went down to about 12.5%, which is a 0.5% decrease. the warriors hahd their transition frequency decreased by about 1.8%. ours decreased by 3.2%
WE were in the 85th percentile in the cut play, and ran it 0.5-0.9% less than the league average
we were in the 80th percentile in the spot up play, and ran it the least out of any team int eh playoffs
ill just sum it up
off the screen - we got better frequency wise
Post up - we got better frequency wise ( i guess, we ran this 8,9% of the time, top 5 in the playoffs, but we probably should have ran it more against the warriors, considering we scored 1.21 ppp. to put this in perspective, the next closest was the spurs, who scored 0.99 ppp)
hand off - no complains, we were among the league leaders in effeciency and frequency
but overall, in terms of how we managed play frequency in the playoffs, I literally cannot express how ridiculously bad it was
Let me put it this way, statistically speaking, even though this might sound stupid, Im pretty much 99% sure that if we replayed the 4 games exaclty how they were, without counting things like how the warriors would be desperate and would try harder, and if we made the plays that the pelicans ran even somewhat decent frequency wise, I think we would have won 3 or 4 of them, and thats by first glance.
(I also failed the time limit so I have to wait a day untill posting this)
Feedback would be appreciated! Im not sure if this stat works very well.
But overall, a top 3 offense is not out of reach.
so obviously, I didnt make that with the purpose of supporting davis. but looking into why the pelicans, we can see why they ran the wrong plays, at times.
first of all, monty williams. he ran good plays. not the right ones.
for davis at least.
looking at each play.
Davis was a bit better than lebron, steph, etc, at the isolation play.
he ran this more than a 130 possessions less than tyreke evans.
Davis, for obvious reasons, is quite possibly the best transition player in the nba.
gortat is suprisingly ridiculously good.
but Davis was good at this in his sophmore season I think. he ran this play
205 times less than tyreke evans.
wht
okay, the only player in the entire nba with alot of possessions that shot better than davis in transition was gortat.
call me crazy, but I think this is noise.
on the otherhand...
for players who had more than 100 possessions...
davis ranked first. the next closest?
want more proof of how good he is in the open floor?
he scored 0.225 more ppp than the player above (I got his stats on hoopsnation, sorry, cant find a link to get synergy stats before this year)

so the player he is decisevly better (this year at least) in isolation is
is ridiculously athleticis, bar none, the most athletic player ever at his positionruns faster than CP3is over 250 poundswas in (in my opinion) his peak, though that year wasnt chosen at his peak.yes. davis (albeit, in less possessions. 100+ possessions is enough imo though)
Davis was decisevely better in transition than...
Lebron in 2009these 2 plays alone, in my calculation, greatly increases the pelicans offensive rating. this trend generally continues
generally, this trend continues. he posted up too much, he spot up too much
one huge slap in the face was his cutting plays. yes, I get that defenders try to take this away from him, but athletically, he should be able to get it more than 128 possessions, or 8.6 percent of his offense. (frequency).
generally, big men have more cut plays.
lets look at Deandre jordans frequency (they wont have more than davis because davis is obviously the focal point of the offense).
Deandre jordan, someone who they literally dont need to guard in the perimeter. athletic freak as well. jumps higher than davis, not as fast though, so easier to contain, probably. stronger though.
his frequency? 22.5%
yes, davis isnt the worst case in terms of frequencies...
the thing is, davis was the absolute BEST PLAYER IN THE NBA
when it came to cuts. he scored a ridiculous 1.54ppp.
0.11ppp better than deandre jordan. and we all know how a deandre jordan cut play goes...
second of all...

more specifically, isolation plays.
isolation plays are fine if you are
A. really good at them.
or B. the only one on your team that can create his own shot.
Tyreke evans had 0.8 points per possession on isolation plays.
0.14ppp less than davisand yet
he had 58 more isolation plays than Russell Westbrook.this is generally a trend.
transition plays, as I said before, he had more possessions than davis.
205 more to be exact
he had a bit more possessions than lebron and curry.
he scored 0.94ppp in transition. the 20th percentile.
in the open floor, he was about as good as davis in isolation.
now, everything I said is pretty much givens, but still.
DefenseNow, let me be clear. defensively, he isnt some monster as the media likes to put him as. however, I think he is an ibaka level defender.
the defensive system is the reason why they were so bad defensively.
According to gordan, they had 15 defensive calls.
now, they will only have 3.
http://www.nba.com/pelicans/video/teams/pelicans/2015/10/06/1444162330376-gordon100615-hd.mp4-44034first of all, now, they will only ice the pick and roll.
before? they had multiple play calls for every situation.
doesent that sound great?
no, its not. unless everyone has a bball iq like garnett or duncans defensive iq, or a leader like bill russell, it is overcomplicated and backfires, shown by the pelicans allowing too many free paths to the rim, often open.
http://www.bourbonstreetshots.com/2015/01/05/an-analysis-on-the-pelicans-defensive-struggles/first of all, that is literally an amazing article. completely irrelevant now, but its a very good article
generally, davis was worse than others at defending the pick and roll, even on his team. so i would say its indeed a weakness
generally, in defensive play types, ranking somewhere in the 70-90th percentile is excellant.
this was from a post in the pelicans fourm as well, so it might have a different tone. i edited a bit though.
Defensively, we expect him to be a traditional big man. That is wrong. In terms of defending play types, that could have been because of the confusion as for what ad has to do. In general, since I guess we all consider Ibaka a top 10 defensive player, lets use him as a measuring sticks, in play types.
He was a bit better overall at man defense (26%)
He was much better at the "non traditional" defense (10%)
He was worse at defending the pick and roll, and the spot up, not as bad as some think though (26%)
And he was probably better at defending in transition too, since that's something we are good at.
Think of someone like Asik, a ridiculously underrated defender in his time in Houston. Why did he suddenly become meh when he came to us?
In terms of what he is good and bad at, when looking at the play type stats, if someone is in the 75th percentile in every play type, that is absolutely excellent.
Davis is very good at defending the ISO (86.5th percentile 0.64ppp), defending the ball handler pick and roll (82.6th percentile, 0.65ppp), defending the off screen (92.8 percentile, 0.55ppp) , defending the handoff (90th percentil,0.61ppp), good enough at defending the post up (71.9 percentile, 0.76ppp)
thats 5 of the play types. however, he rarely defending 3 of those playtypes, but altogether, they make something like 10-15% of the plays he faced.
His defensive impact metrics, rapm, in the pi studies, put him as an above average defender,
despite being prior informed by his sophomore season where he was crap on that end.npi studies put him as a good defender again. not mind boggling, but they went on a "run" without him (against teams like the knicks... wait they lost to the knicks lol)
Realistically, he wasn't even bad at defending the spot up, he was very, very slightly below average.
edit: upon further review, he was actually not as bad as I thought. apparently, bigs arent very good at this.
Spot-up: .98 ppp on 177 poss; 14th among bigs, 58th overall
So he is excellent at defending off screen, handoff, and the ball handler p and r, he faced these plays a combined 36 is percent of the time. he faced these plays 9% of the time.
he was phenomenal at defending the iso. he faced this play 11.3% of the time.
he was good at defending the post up, definitely a good deal above average, and he faced this 16.1% of the time
He was bad at defending the roll man pick and roll. 9% of the time.
Average at defending the spot up. above average for his position though. 19% of the time
Only around 50-70% of plays are tracked defensively.
He is excellent at defending 20.3% of plays.
He was good enough, definately above average for his position, at defending 35.1% of the plays he faced
He was bad at defending 9% of plays
Despite playing in an absolutely horrible system that limitted asik as well (whose rapm, despite being in a team with people like ryan anderson as potential starters, instead of subbing for howard, his raw on-off is basically the same as it was for the rockets last year, where he was also reportedly not happy, which usually would effect his performance
Considering that we are good in transition defense and the only player to do anything in transition is Davis, I think he would be among the league leaders in transition d as well.
so thats probably roughly around 30% of plays he is excellent in.
Deandre jordan, (overrated imo as a rim protecter), had DPOY plaudits, Despite Davis being better at nearly everything, and being 1% off in rim protection? Then I think Davis is at least Ibaka level, maybe a bit lower. A bit.
And talent wise, he is above top 10. He was utilized correctly, and his defensive impact, despite the prior years absolutely destroying his rapm, is still very, very good.
Relative to position, for all players averaging 25 minutes, he was a top 20 rim protecting big man. good enough.
Also, I don't think it's a coincidence that we play in a horrid defensive system and this happens. in a correct defensive system, I believe he would do better.
Asik, in a controversy filled season with the rockets...held opponents at 46.8% at the rim.
With us, despite having a league leading shot blocker by his side, opponents shoot 51.1% at him at the rim?if we do believe its teh system, then davis, applying the same regression, should have held opponents at around 42-43% at the rim, which would be excellent.
The system made him look bad. It wasn't him making guesses. It was him covering up for everyone else.
so I believe he is a top 10 ish defender.
on a sidenote, with him as the closest defender, he might be the best player in the league in that regard.
in terms of difference in fg% with the player as the closest defender...
adjusting for 50+ games (and even if I dont, people like nate robinson and alonzo gee, though I believe alonzo gee is unfairly shown as a bad defender by impact metrics, just, well, no).
difference in fg% leaders for 50+ games
1. Tony allen difference -6.8% 2.7/7.8 per game
2. Draymond Green difference -6.3% 5.5/14 per game
3. Anthony Daivs difference 6.2% 5.8/14.4 per game
consider volumes, and its basically the same as draymond
so if he was in teh right defensive system, i wonder if he would do better?
for comparison, here is asik.
this year, players shot a 1.8%
higher percentage when guarded by asik
with houstan, players shot 2.8% lower when guarded by asik
I really, really think its the system
synergy isnt everything, obviously, but he was a good defender in kentucky by every stretch of the imagination, I doubt that for some reason he went down.
Davis isnt half the defender diwght is, and synergy stats say dwight was a better defender in los angelas than in orlando, but compare that with dwights 11 orlando synergy stats

granted, another thing we have to look at is volume, but even still, I think davis is a good enough defender, definately man to man, so I guess he is a very "versitile" defender in the clutch as well, which should be worth something.
Rebounding
he isnt half the rebounder dwight is, but his rebounds were generally contested, meaning that if he didnt get the rebound, the other team would have gotten it instead.
he was 7th in the league in contested rebounds.
I would also like to note that he doesent go for rebounds as much, whether it be because of his coach or his playstyle.
now, in terms of rebound chances per game, despite his minutes, he gets
14.9 rebound chances a gamethat aint much.
he gets 69% of the rebounds that he has a chance to get. thats 7th in the league.
3 of the players above him have a higher percentage of their rebounds uncontested.
for a reference, in a rebounding position, he gets 0.2% less rebounds he could have gotten in a rebounding position than cousins.