"Prime" stands for the best consecutive 5-year stretch of a player's career. Please disregard how long these guys' primes were, instead focus on quality (I'm trying to keep it even, at 5 seasons for each player, to make the comparison fair).
Marques Johnson 1979-83:
370 games - 21.3 ppg/7.1 rpg/3.9 apg/1.3 spg/0.8 bpg in 34.5 mpg/21.6 PER, 19.5 WS/48, 57.3% TS/11.4% TOV
playoffs:
29 games - 21.5 ppg/7.9 rpg/3.9 rpg/1.0 spg/0.8 bpg in 40.9 mpg/18.7 PER, 14.8 WS/48, 51.3% TS/8.2% TOV
Adrian Dantley 1980-84:
330 games - 30.0 ppg/6.4 rpg/3.8 apg/1.2 spg/0.2 bpg in 40.0 mpg/24.4 PER, 20.2 WS/48, 63.6% TS/13.0% TOV
playoffs:
11 games - 32.2 ppg/7.5 rpg/4.2 apg/0.9 spg/0.1 bpg in 41.3 mpg/24.7 PER, 20.7 WS/48, 60.4% TS/11.5% TOV
Bernard King 1981-85:
360 games - 24.8 ppg/5.7 rpg/3.1 apg/1.1 spg/0.3 bpg in 35.3 mpg/21.4 PER/16.8 WS/48/59.8% TS/13.2% TOV
playoffs:
18 games - 31.0 ppg/5.4 rpg/2.7 apg/0.9 spg/0.3 bpg in 36.7 mpg/26.6 PER, 23.1 WS/48, 62.2% TS/8.4% TOV
Alex English 1982-86:
408 games - 27.6 ppg/6.1 rpg/4.7 apg/1.1 spg/1.0 bpg in 36.3 mpg/22.4 PER,15.1 WS/48, 56.9% TS/11.2% TOV
playoffs:
39 games - 27.7 ppg/6.0 rpg/5.2 apg/0.8 spg/0.5 bpg in 39.0 mpg/20.8 PER,15.1 WS/48, 56.4% TS/8.6% TOV
Mark Aguirre 1984-88:
390 games - 25.8 ppg/5.8 rpg/3.8 apg/0.9 spg/0.4 bpg in 34.3 mpg/21.7 PER, 13.8 WS/48, 55.7% TS/11.8% TOV
playoffs:
45 games - 23.0 ppg/6.7 rpg/3.7 apg/0.9 spg/0.3 bpg in 34.4 mpg/20.2 PER, 10.1 WS/48, 54.1% TS/10.7% TOV
Dominique Wilkins 1986-90:
395 games - 28.6 ppg/6.8 rpg/2.8 apg/1.5 spg/0.6 bpg in 37.6 mpg/23.4 PER, 17.5 WS/48, 53.9% TS/9.0% TOV
playoffs:
35 games - 28.8 ppg/6.5 rpg/2.9 apg/1.3 spg/0.7 bpg in 40.1 mpg/19.7 PER, 8.8 WS/48, 51.3% TS/9.1% TOV
James Worthy 1986-90:
393 games - 20.1 ppg/5.6 rpg/3.3 apg/1.2 spg/0.8 bpg in 35.2 mpg/19.2 PER, 16.3 WS/48, 58.6% TS/10.8% TOV
playoffs:
80 games - 22.4 ppg/5.7 rpg/3.5 apg/1.4 spg/0.9 bpg in 38.5 mpg/19.4 PER, 14.9 WS/48, 58.7% TS/10.8% TOV
Rank these small forwards in their primes
Moderators: penbeast0, PaulieWal, Clyde Frazier, Doctor MJ, trex_8063
Rank these small forwards in their primes
-
Quotatious

- Retired Mod

- Posts: 16,999
- And1: 11,145
- Joined: Nov 15, 2013
Re: Rank these small forwards in their primes
-
penbeast0
- Senior Mod - NBA Player Comparisons

- Posts: 30,754
- And1: 10,156
- Joined: Aug 14, 2004
- Location: South Florida
-


Re: Rank these small forwards in their primes
1. English -- scores like Nique (in a faster paced system but one in which he doesn't get all the isolations that Nique needed either, doubles Nique's assists, clearly better defense, plus he doesn't crash in the playoffs. At different times in Denver was their main post up threat, their main front court defensive stopper, their point forward, and their catch and shoot scorer. You'd watch him and think he wasn't having a great game and look at the scoresheet and he'd have 25-30 quiet points.
2. Marques -- shame his career was cut short. Probably the best defender and rebounder in the bunch, had all the tools and great athleticism but didn't have English's versatility or court intelligence.
(gap)
3. King/Dantley -- the two most dangerous scorers (yes, more than Nique), both did well in the playoffs, particularly King, both very me-first players who had a strong black hole streak. Neither bothered much with defense, Dantley had less injury issues and to my perception a better attitude but his problems with Frank Layden and Isiah give him a rep as a bad apple rather than just a hard player to fit into an offense not built around him.
4. Nique -- Much classier guy than King or Dantley from all I've heard; one of the most athletic scorers of all time with great longevity; but voted by NBA players in a TSN poll as the guy who put the least effort in on defense in the league (over Gervin and Dantley among others). His lower efficiency is matched by lower turnovers.
5. Worthy -- Big Game James but had less range than most of these peers and was less of a scoring threat though very efficient. Good defense, but for a guy who payed as much PF as Worthy did, a weak rebounder and not great passer. If this was career value, he'd have a good argument for 2nd or 3rd behind English and probably Nique.
6. Aguirre -- May be up there with NIque but always seemed like a player who was less than the sum of his numbers.
“Most people use statistics like a drunk man uses a lamppost; more for support than illumination,” Andrew Lang.
Re: Rank these small forwards in their primes
-
COM_GTFO
- Sophomore
- Posts: 181
- And1: 118
- Joined: Aug 05, 2013
-


Re: Rank these small forwards in their primes
It's a little insulting to put Wilkins in this kind of company. He's easily the best player out of the lot.
Re: Rank these small forwards in their primes
-
COM_GTFO
- Sophomore
- Posts: 181
- And1: 118
- Joined: Aug 05, 2013
-
Re: Rank these small forwards in their primes
penbeast0 wrote:King/Dantley -- the two most dangerous scorers (yes, more than Nique), both did well in the playoffs, particularly King, both very me-first players who had a strong black hole streak. Neither bothered much with defense, Dantley had less injury issues and to my perception a better attitude but his problems with Frank Layden and Isiah give him a rep as a bad apple rather than just a hard player to fit into an offense not built around him.
How exactly are King/Dantley - two guys who could never even lead their team to a 50-win season - ahead of Wilkins?
Re: Rank these small forwards in their primes
-
penbeast0
- Senior Mod - NBA Player Comparisons
- Posts: 30,754
- And1: 10,156
- Joined: Aug 14, 2004
- Location: South Florida
-
Re: Rank these small forwards in their primes
All 3 are primarily scorers. Those two are better scorers than Nique . . . as prolific and more efficient. There isn't anything other than intangibles (as I said, Nique is a classy guy, the other two had issues) that Nique does better -- he isn't a better defender, not a significantly better at non scoring offense (slightly better rebounder, slightly worse playmaker). Nique also suffers a much greater drop in playoff efficiency; the other two stay roughly even or even improve. For the limited period that the OP was asking about, King and Dantley were superior.
Career, Nique is second only to English because he stayed at that prime level for a decade while the others had much shorter primes. But that wasn't what the OP asked.
I've given reasons why English's career and, by the terms defined by the OP, Marques Johnson, King, and Dantley's primes are superior to Nique's. Do you have any kind of counter to that other than crying that it's an insult to allow a fair comparison between Nique and his contemporaries?
(Hint: Nique did have 1 major advantage over most/all of the others -- accolades. OF course, that's just substituting "because someone else says so" for "because I say so" but at least it's a reason.)
“Most people use statistics like a drunk man uses a lamppost; more for support than illumination,” Andrew Lang.
Re: Rank these small forwards in their primes
-
penbeast0
- Senior Mod - NBA Player Comparisons
- Posts: 30,754
- And1: 10,156
- Joined: Aug 14, 2004
- Location: South Florida
-
Re: Rank these small forwards in their primes
Just one little extra point for what it's worth (not that much probably) -- when Dantley got a good team around him, he led Detroit in scoring in 87, 88, and the first half of 89 -- all three years he either won more than 50 or was on a pace to win more than 50 until dealt for Mark Aquirre (apparently at Isiah Thomas's request).
Those teams were loaded so I'm not sure what it proves other than maybe disproving the idea that Dantley couldn't be the leading scorer for a winning team.
Those teams were loaded so I'm not sure what it proves other than maybe disproving the idea that Dantley couldn't be the leading scorer for a winning team.
“Most people use statistics like a drunk man uses a lamppost; more for support than illumination,” Andrew Lang.
Re: Rank these small forwards in their primes
-
DQuinn1575
- Sixth Man
- Posts: 1,957
- And1: 714
- Joined: Feb 20, 2014
Re: Rank these small forwards in their primes
COM_GTFO wrote:penbeast0 wrote:King/Dantley -- the two most dangerous scorers (yes, more than Nique), both did well in the playoffs, particularly King, both very me-first players who had a strong black hole streak. Neither bothered much with defense, Dantley had less injury issues and to my perception a better attitude but his problems with Frank Layden and Isiah give him a rep as a bad apple rather than just a hard player to fit into an offense not built around him.
How exactly are King/Dantley - two guys who could never even lead their team to a 50-win season - ahead of Wilkins?
84 Knicks were in division with Moses/doctor j sixers and bird celtics
Team had srs higher than Moses/doctor j AND magic/Kareem lakers
3rd in league
In prime king was decidedly best IMO
I'm still thinking about others
Sent from my iPhone using RealGM Forums
Re: Rank these small forwards in their primes
-
Moonbeam
- Forum Mod - Blazers

- Posts: 10,383
- And1: 5,120
- Joined: Feb 21, 2009
- Location: Sydney, Australia
-


Re: Rank these small forwards in their primes
Ah, the glory days of the 80s SFs. It was so fun to watch at the time, although I just caught the tail end of it!
I'll have to think about my rankings a bit before posting them, but I'll post a few more stats from these periods.
Marques Johnson 1979-83: 3.46 ASPM (3.04 O, -0.36 D), 3.76 VORP
Adrian Dantley 1980-84: 3.2 ASPM (4.86 O, 1.64 D), 3.7 VORP
Bernard King 1981-85: 2.94 ASPM (3.48 O, 0.56 D), 3.3 VORP
Alex English 1982-86: 2.4 ASPM (3.8 O, 1.38 D), 3.58 VORP
Mark Aguirre 1984-88: 2.14 ASPM (3.42 O, 1.24 D), 3.08 VORP
Dominique Wilkins 1986-90: 3.4 ASPM (3.48 O, 0.08 D), 4.3 VORP
James Worthy 1986-90: 2.28 ASPM (2.48 O, 0.18 D), 3.24 VORP
I got these figures from this page. I'm not sure how I feel about them yet, but thought I'd share.
Re: Rank these small forwards in their primes
-
penbeast0
- Senior Mod - NBA Player Comparisons
- Posts: 30,754
- And1: 10,156
- Joined: Aug 14, 2004
- Location: South Florida
-
Re: Rank these small forwards in their primes
Other than Dantley, who is significantly higher on O, and Worthy, who is significantly lower on O, most of the differentiation comes defensively.
Marques Johnson is the highest rated defender; not that great a surprise.
...but,
Nique is better defensively than Worthy(!)
Dantley is better defensively than English(!)
Those don't match the eye test. How affected by team environment are these?
(Example, Dantley has Mark Eaton and Thurl Bailey behind him while English has Dan Issel and Kiki Vandeweghe . . . that might make a significant difference).
For VORP, this does have NIque out front of his peers and Aguirre behind them -- closer to the popular/media impression.
“Most people use statistics like a drunk man uses a lamppost; more for support than illumination,” Andrew Lang.
Re: Rank these small forwards in their primes
-
Moonbeam
- Forum Mod - Blazers
- Posts: 10,383
- And1: 5,120
- Joined: Feb 21, 2009
- Location: Sydney, Australia
-
Re: Rank these small forwards in their primes
penbeast0 wrote:Other than Dantley, who is significantly higher on O, and Worthy, who is significantly lower on O, most of the differentiation comes defensively.
Marques Johnson is the highest rated defender; not that great a surprise.
...but,
Nique is better defensively than Worthy(!)
Dantley is better defensively than English(!)
Those don't match the eye test. How affected by team environment are these?
(Example, Dantley has Mark Eaton and Thurl Bailey behind him while English has Dan Issel and Kiki Vandeweghe . . . that might make a significant difference).
For VORP, this does have NIque out front of his peers and Aguirre behind them -- closer to the popular/media impression.
For what it's worth, during their primes, English does rate ahead of Dantley defensively, although for their careers Dantley comes out ahead. For Worthy/Dominique, their relative ranking also flips when looking at their careers. It is the defensive side of ASPM that I question the most, too. I'll have to read up on it more to see how I feel about it. That said, I think it's pretty clear that all of these guys bring more to the table on offense than defense.
Re: Rank these small forwards in their primes
-
CaliBullsFan
- Banned User
- Posts: 2,491
- And1: 244
- Joined: Aug 14, 2013
Re: Rank these small forwards in their primes
1.King
2.Nique
3.Aguirre/English/Johnson
4.Dantley
5.Worthy
2.Nique
3.Aguirre/English/Johnson
4.Dantley
5.Worthy
Re: Rank these small forwards in their primes
-
penbeast0
- Senior Mod - NBA Player Comparisons
- Posts: 30,754
- And1: 10,156
- Joined: Aug 14, 2004
- Location: South Florida
-
Re: Rank these small forwards in their primes
CaliBullsFan wrote:1.King
2.Nique
3.Aguirre/English/Johnson
4.Dantley
5.Worthy
Based on WHAT?
“Most people use statistics like a drunk man uses a lamppost; more for support than illumination,” Andrew Lang.
Re: Rank these small forwards in their primes
-
Johnlac1
- Lead Assistant
- Posts: 5,326
- And1: 1,605
- Joined: Jan 21, 2012
-


Re: Rank these small forwards in their primes
penbeast0 wrote:Just one little extra point for what it's worth (not that much probably) -- when Dantley got a good team around him, he led Detroit in scoring in 87, 88, and the first half of 89 -- all three years he either won more than 50 or was on a pace to win more than 50 until dealt for Mark Aquirre (apparently at Isiah Thomas's request).
Those teams were loaded so I'm not sure what it proves other than maybe disproving the idea that Dantley couldn't be the leading scorer for a winning team.
The '88 Pistons came within an eyelash (or Thomas's ankle injury) of winning it all. They lost game six by one point, and game seven by three pts. with Thomas playing on a severely injured ankle. Dantley led the Pistons in average ppg that year and led them in scoring in the playoffs. He's been unfairly maligned as a ballhog/gunner, but I believe Utah made a mistake getting rid of him. He would have been the other great scorer the Jazz needed to compete with LA during that time.
Re: Rank these small forwards in their primes
-
penbeast0
- Senior Mod - NBA Player Comparisons
- Posts: 30,754
- And1: 10,156
- Joined: Aug 14, 2004
- Location: South Florida
-
Re: Rank these small forwards in their primes
Well, to defend Frank Layden (he was pretty funny too at times), Utah had Eaton and Bailey on their front line who were both post up players (ok, Eaton was just a complete stiff offensively but you sort of had to park him near the basket so he could take up space to get the occasional offensive board). To use Dantley effectively, you needed bigs that could work further from the basket so Dantley could post up (same for Aguirre to some degree). Detroit was a good situation for him with Laimbeer's range and Rodman being active even if he didn't have any range either.
“Most people use statistics like a drunk man uses a lamppost; more for support than illumination,” Andrew Lang.
Re: Rank these small forwards in their primes
-
Johnlac1
- Lead Assistant
- Posts: 5,326
- And1: 1,605
- Joined: Jan 21, 2012
-
Re: Rank these small forwards in their primes
penbeast0 wrote:Well, to defend Frank Layden (he was pretty funny too at times), Utah had Eaton and Bailey on their front line who were both post up players (ok, Eaton was just a complete stiff offensively but you sort of had to park him near the basket so he could take up space to get the occasional offensive board). To use Dantley effectively, you needed bigs that could work further from the basket so Dantley could post up (same for Aguirre to some degree). Detroit was a good situation for him with Laimbeer's range and Rodman being active even if he didn't have any range either.
Good points, but looking at Utah from that time period, it seemed to be they needed another strong scorer to complement Malone. They had in Stockton and Malone two of the best players at their respective positions in the league, and Eaton was an effective def center. But it just seemed to me they didn't have enough firepower to compete with the Lakers in the late eighties.
Re: Rank these small forwards in their primes
-
Moonbeam
- Forum Mod - Blazers
- Posts: 10,383
- And1: 5,120
- Joined: Feb 21, 2009
- Location: Sydney, Australia
-
Re: Rank these small forwards in their primes
I love looking at these guys because most of my favorite players are small forwards, and it was such an exciting time to watch, as these guys were each capable of amazing offensive outbursts.
One thing I've taken a hard look at is how to weigh up offensive statistics in the context of team offense. There has been a fair bit of discussion in the Top 100 poll about how to gauge individual performance based on team performance (e.g. Garnett's Minny teams did not generally excel on defense, how to compare Kidd's team offenses to Payton's given teammate quality), so I tried to come up with a rough model of expectations for team offense.
I used offensive win shares as the basis for this analysis. I know many aren't happy with OWS, but on a team-level, it is very strongly correlated with offensive rating, which is a good measure of overall team offensive performance. I looked at all regular season data from 1977-2014 to come up with a set of aging curves to encompass different types of peak shapes. I've used five different levels of peak sharpness and five different peak ages (21, 24, 27, 30, and 33), which makes it possible to model a player's career based on OWS/48, like this:
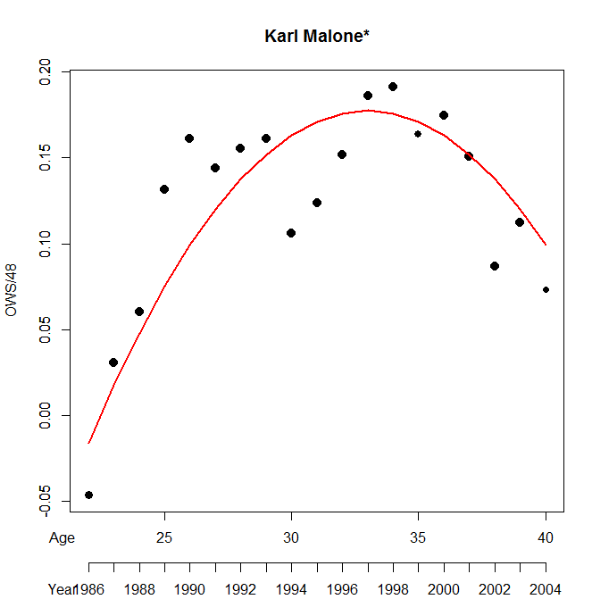
This is a very simple approach, but I wanted something specific enough to broadly capture the relationship between offensive production and aging, but not too specific as to produce perfect models - I'm interested in the deviations from expectations, after all, so I'm happy with a bit of noise.
Based on these curves of expected OWS/48, I then looked at team offense relative to expectations as judged by total OWS. I'm still looking to road-test this analysis, so if you know of any instances where you felt a team overachieved or underachieved its talent level, I'd be eager to check it against my model!
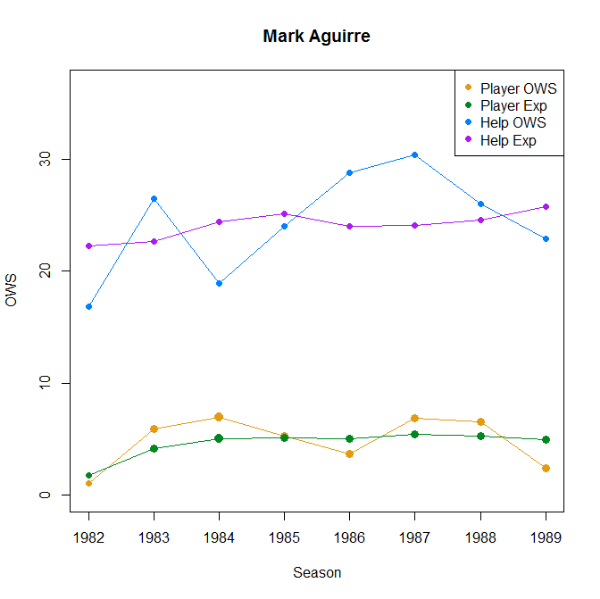
I parsed out performance relative to expectations for each of these players plus Larry Bird (in >28 MPG seasons) and their respective teammates as a whole. Why 28 MPG? I wanted to include enough seasons to get a big picture view, plus I wanted to avoid discontinuities where I could (e.g. Bernard King's 1988 season). Here are the resulting plots of player OWS, player expected OWS, teammate ("help") OWS and expected teammate OWS:
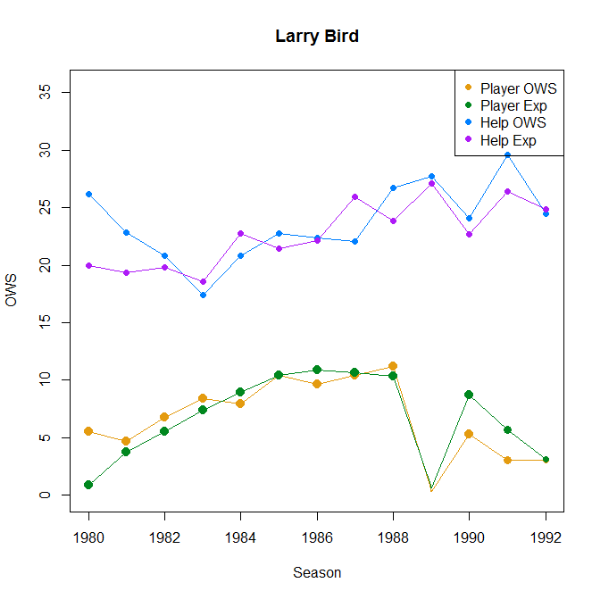
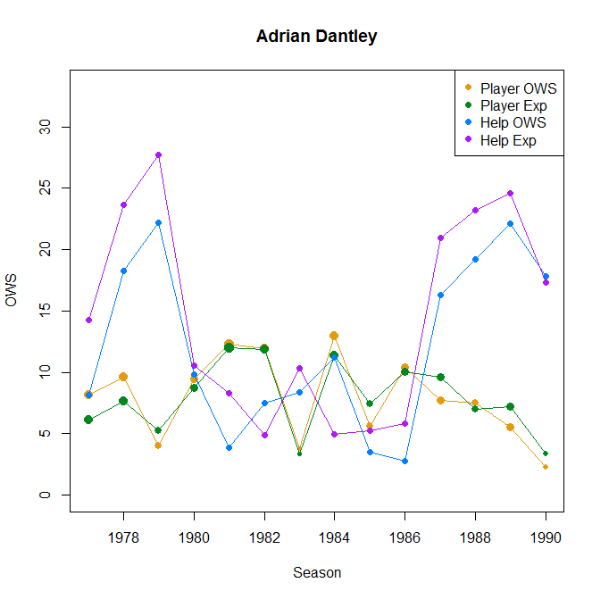
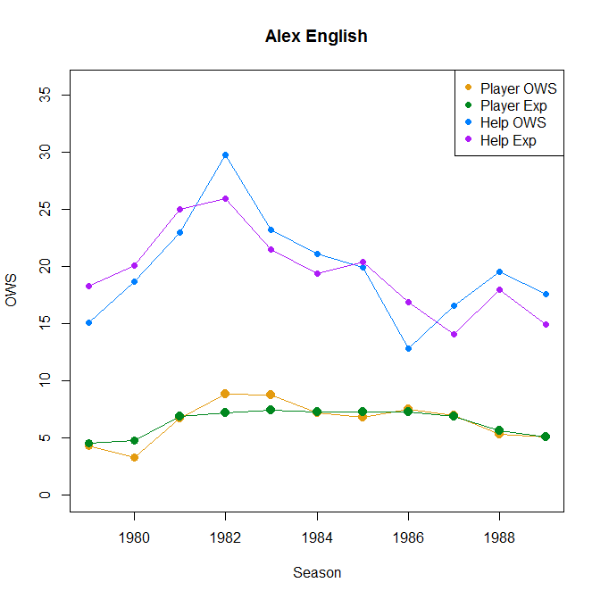
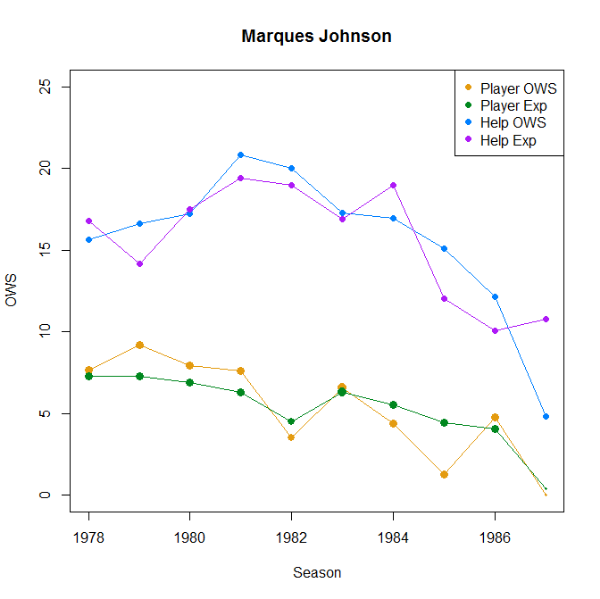
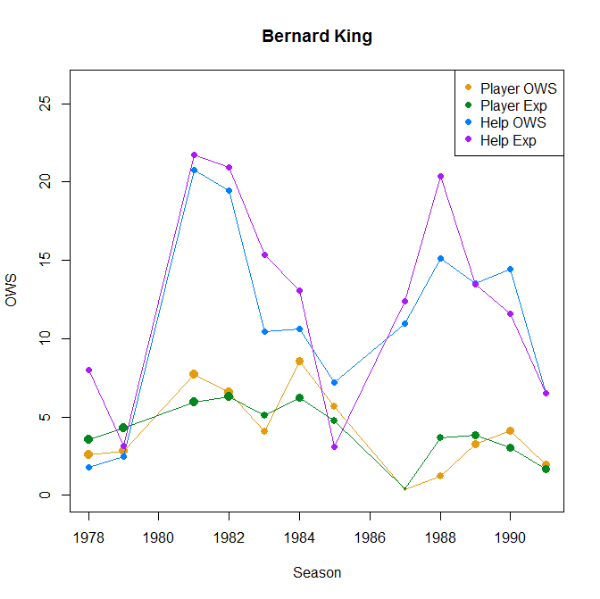
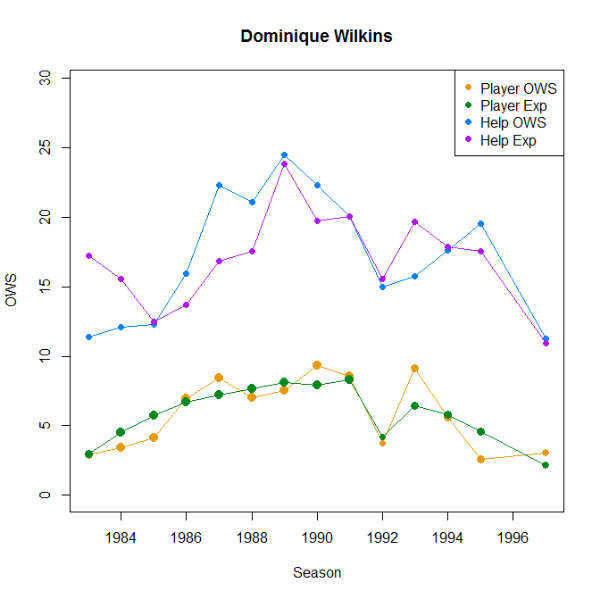
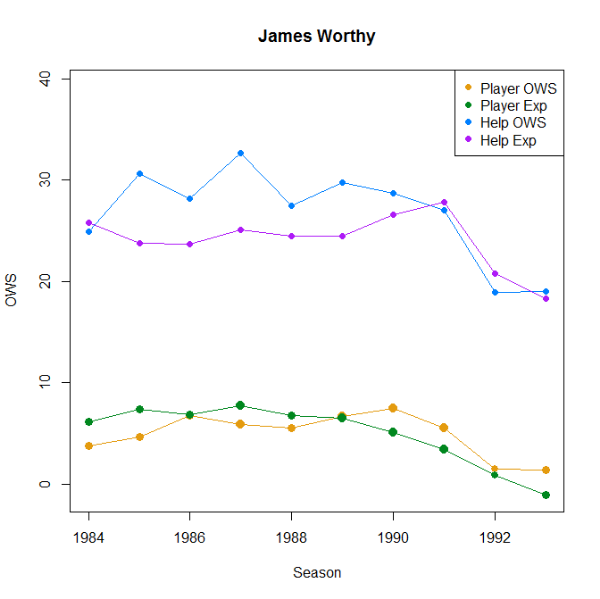
Over this span, here are the MP-weighted averages for player OWS, % of team OWS, both rate and raw difference of help OWS to expectations:
On the surface, it looks like Dantley (and to a lesser extent, King) may be getting their Win Shares somewhat at the expense of teammates, while Bird and Worthy are associated with boosts for their teammates. How much praise (or blame) should be apportioned for performance of teammates is up for debate, but I think it at least provides a framework for comparison.
Taking a look at the 5-year intervals in the OP:
Dantley is clearly the leader in both OWS and percentage of team offense (some of those supporting casts in Utah look dreadful), but perhaps he didn't provide the "lift" as others (or worse, perhaps his presence deflated his teammates offense). If we split his career into phases, it seems his early career is where his teammates fared the worst (0.731 rate, fit issues with Lakers?), while in Utah they performed nearly to (awful) expectations (0.968 rate), while in Detroit during 87-88, the rate fell to 0.801 (problems of fit with Isiah?), and across 89-90, it was 0.935.
I don't think Worthy's help numbers are attributable to him so much as they are to Magic, but he clearly fit into Showtime quite well. Wilkins looks like he could have provided decent lift across 86-90, and Aguirre's apparent issues with teammates did not seem to affect his teams' offenses.
I've got H2H stats I can post later, but I thought I'd put this out there as it's a fascinating comparison for me.
One thing I've taken a hard look at is how to weigh up offensive statistics in the context of team offense. There has been a fair bit of discussion in the Top 100 poll about how to gauge individual performance based on team performance (e.g. Garnett's Minny teams did not generally excel on defense, how to compare Kidd's team offenses to Payton's given teammate quality), so I tried to come up with a rough model of expectations for team offense.
I used offensive win shares as the basis for this analysis. I know many aren't happy with OWS, but on a team-level, it is very strongly correlated with offensive rating, which is a good measure of overall team offensive performance. I looked at all regular season data from 1977-2014 to come up with a set of aging curves to encompass different types of peak shapes. I've used five different levels of peak sharpness and five different peak ages (21, 24, 27, 30, and 33), which makes it possible to model a player's career based on OWS/48, like this:
This is a very simple approach, but I wanted something specific enough to broadly capture the relationship between offensive production and aging, but not too specific as to produce perfect models - I'm interested in the deviations from expectations, after all, so I'm happy with a bit of noise.
Based on these curves of expected OWS/48, I then looked at team offense relative to expectations as judged by total OWS. I'm still looking to road-test this analysis, so if you know of any instances where you felt a team overachieved or underachieved its talent level, I'd be eager to check it against my model!
I parsed out performance relative to expectations for each of these players plus Larry Bird (in >28 MPG seasons) and their respective teammates as a whole. Why 28 MPG? I wanted to include enough seasons to get a big picture view, plus I wanted to avoid discontinuities where I could (e.g. Bernard King's 1988 season). Here are the resulting plots of player OWS, player expected OWS, teammate ("help") OWS and expected teammate OWS:
Over this span, here are the MP-weighted averages for player OWS, % of team OWS, both rate and raw difference of help OWS to expectations:
Code: Select all
Player   WtOWS   %Off  Help Rate  Help Diff
Aguirre  5.112  0.166    1.018      +0.428
Bird     7.429  0.220    1.048      +1.056
Dantley  8.803  0.394    0.844      -2.155
English  6.536  0.246    1.016      +0.307
Johnson  5.954  0.253    1.040      +0.636
King     4.466  0.269    0.887      -1.413
Wilkins  6.084  0.255    1.015      +0.260
Worthy   5.065  0.155    1.116      +2.809
On the surface, it looks like Dantley (and to a lesser extent, King) may be getting their Win Shares somewhat at the expense of teammates, while Bird and Worthy are associated with boosts for their teammates. How much praise (or blame) should be apportioned for performance of teammates is up for debate, but I think it at least provides a framework for comparison.
Taking a look at the 5-year intervals in the OP:
Code: Select all
Player  Years   WtOWS   %Off  Help Rate  Help Diff
Aguirre 84-88   5.920  0.187    1.041      +1.005
Bird    84-88   9.933  0.302    0.989      -0.257
Dantley 80-84  11.213  0.553    1.083      +0.606
English 82-86   7.849  0.268    1.026      +0.548
Johnson 79-83   7.192  0.275    1.057      +0.984
King    81-85   6.675  0.323    0.919      -1.268
Wilkins 86-90   7.835  0.270    1.158      +2.891
Worthy  86-90   6.465  0.180    1.181      +4.496
Dantley is clearly the leader in both OWS and percentage of team offense (some of those supporting casts in Utah look dreadful), but perhaps he didn't provide the "lift" as others (or worse, perhaps his presence deflated his teammates offense). If we split his career into phases, it seems his early career is where his teammates fared the worst (0.731 rate, fit issues with Lakers?), while in Utah they performed nearly to (awful) expectations (0.968 rate), while in Detroit during 87-88, the rate fell to 0.801 (problems of fit with Isiah?), and across 89-90, it was 0.935.
I don't think Worthy's help numbers are attributable to him so much as they are to Magic, but he clearly fit into Showtime quite well. Wilkins looks like he could have provided decent lift across 86-90, and Aguirre's apparent issues with teammates did not seem to affect his teams' offenses.
I've got H2H stats I can post later, but I thought I'd put this out there as it's a fascinating comparison for me.
Re: Rank these small forwards in their primes
-
penbeast0
- Senior Mod - NBA Player Comparisons
- Posts: 30,754
- And1: 10,156
- Joined: Aug 14, 2004
- Location: South Florida
-
Re: Rank these small forwards in their primes
I never liked Aquirre because he slacked on defense and tended to look lazy but what issues did he have with teammates?
“Most people use statistics like a drunk man uses a lamppost; more for support than illumination,” Andrew Lang.
Re: Rank these small forwards in their primes
-
Moonbeam
- Forum Mod - Blazers
- Posts: 10,383
- And1: 5,120
- Joined: Feb 21, 2009
- Location: Sydney, Australia
-
Re: Rank these small forwards in their primes
http://157.166.253.202/vault/article/ma ... /index.htm
After the Dantley-Aguirre trade:
After the Dantley-Aguirre trade:
Actually, there's one Detroit player who had a lot to do with the trade. Dennis (Worm) Rodman had begun to take minutes away from Dantley with his often spectacular play. Dantley saw how the Worm was turning in Detroit and didn't like it. He met privately with Daly after a Sunday-morning shootaround on Jan. 29 to express displeasure at his reduced role, but Daly wouldn't promise him that the situation would change.
And then there were the whispers that the Teacher had started to let down on the court. " 'Let down' is too strong," says one Piston—not Thomas—who requests anonymity. "It was more of a subtle problem with team chemistry. AD was unhappy and let you know it." This Detroit player also believes that, consciously or subconsciously, Dantley didn't get out and run on the break, as Daly wanted him to, because Dantley had too much to gain when the Pistons operated from their half-court offense. Like what? Like the ball, maybe seven of 10 times.
Well, that criticism qualifies as a panegyric when compared with the verbal missiles that Aguirre's former teammates launched at his broad back.
Dallas center James Donaldson: "I'm ready for somebody to come in here who's willing to play hard every night. Sometimes Mark would just loaf."
Guard Rolando Blackman: "Mark could dominate a game when he wanted to, only when he was in the right frame of mind. You just can't let your teammates down, and he let us down a lot."
Forward Sam Perkins: "Today should be an all-day party because he's gone. Good luck, Detroit, because you're going to need it."
Aguirre was asked about the barbs last week as he relaxed in the suburban Detroit hotel that will be his home until he and his wife, Angela, find an apartment. "Maybe they felt like I deserted them," said Aguirre. "Well, I didn't. It was a management decision."
Whoa, Mark, slip me some spin.
"Maybe if we had been a little more of a family, instead of letting the media tear us apart, things would've been better," continued Aguirre.
"Look, everything I ever did in Dallas, every problem that Dick Motta [who feuded with Aguirre when he coached the Mavs and who, as the Pistons' TV color man, is now, in a sense, reunited with him] and I ever had, was blown out of proportion. The only thing that was interesting about the Dallas Mavericks was my problems."
That's partially true, except that Aguirre created much of his trouble. But he has changed addresses now, and one thing is for sure: It's put-up-or-shut-up time for Mark Anthony Aguirre. He's playing ball with his buddy Thomas for the first time since high school, when, as members of the Whiz Kids, they confounded older teams in the Chicago summer leagues. He's with a team that knows how to win and with a coach who says he'll "force-feed" Aguirre minutes to whip him into shape. And he's in a system that wants, and needs, his varied offensive talents—low-post scoring, perimeter shooting, running the floor, and getting the ball to the open man when double-teamed.
Re: Rank these small forwards in their primes
-
penbeast0
- Senior Mod - NBA Player Comparisons
- Posts: 30,754
- And1: 10,156
- Joined: Aug 14, 2004
- Location: South Florida
-
Re: Rank these small forwards in their primes
Ouch, I knew he had had problems with coaches but those are some nasty comments from normally classy players.
“Most people use statistics like a drunk man uses a lamppost; more for support than illumination,” Andrew Lang.
Re: Rank these small forwards in their primes
-
Moonbeam
- Forum Mod - Blazers
- Posts: 10,383
- And1: 5,120
- Joined: Feb 21, 2009
- Location: Sydney, Australia
-
Re: Rank these small forwards in their primes
I've compiled some extensive head to head comparisons for Bird, Erving, Aguirre, Dantley, English, Johnson, King, Wilkins, and Worthy, keeping games in seasons where both players averaged at least 27 MPG. I know that head-to-head matchups aren't the best way of evaluating players, but I thought it would make for an interesting comparison to see how the high-scoring duels panned out overall.
A full set of spreadsheets with yearly comparisons of each player against all of the others collectively, as well as the 36 individual player vs. player matchups here.
Below I'll post the summaries for each player against all of the others collectively. TS values with asterisks imply that up to half of the games in that season have missing statistics.
The column "Vs. Exp" is a comparison of team margin vs. SRS expectations, taking into account homecourt advantage. Each of the columns labelled "Rel" indicate difference from season averages of the previous column.
Larry Bird:
As expected, Bird enjoyed great team success against the competition, sporting a .605 winning percentage. He outscored his opponents by about a point on TS 2% better than his opponents (since 1982), and had massive advantages in rebounds and assists, as you would expect. Interestingly, both his TS and his opponents' TS dropped by more than 2% from their respective averages.
Julius Erving:
I was a little surprised that Dr. J ended up on the wrong end of the scoring comparison on nearly identical efficiency to his opponents. Still, the bulk of the data came as he was winding down his career, with rebounding, assist and TS stats only available from 1982 onward. Still, his teams enjoyed the third best winning percentage among the 9 players considered here.
Mark Aguirre:
Aguirre has a scoring edge over his opponents on slightly worse efficiency, and is neck and neck in both rebounding and assists since 1986. His teams didn't do so hot, though, with a 0.437 winning percentage (only posting winning records against these opponents twice) and an average performance of 0.52 points worse than SRS expectations.
Adrian Dantley:
As you might expect, Dantley has the largest scoring margin of the 9 players considered here, outgunning his opponents by over 3 PPG on nearly 8% better TS. Team success in Utah was predictably poor (particularly 1985 and 1986), though not relative to SRS expectations. In fact, his teams tended to outperform their SRS expectations against this set of opponents. Most surprising may be that his opponents' scoring average was more than a point less than their respective season averages overall, and while his time in Detroit did contribute to that, his opponents weren't going crazy on him in Utah, even prior to the Jazz becoming good on defense in 1983. He loses out on rebounds and assists, though I imagine this is somewhat distorted by the fact the data is mostly available after he assumed a reduced role in Detroit and Dallas.
Alex English:
English's scoring is right on par with that of his opponents, but on 5% worse efficiency. I imagine a lot of that can be chalked up to Denver's poor team defense throughout his time there. Like Erving and Dantley, his rebounding and playmaking abilities are probably undersold by the totals, although he enjoys an edge in assists even in his later years. Team success was quite variable, with 1985 shining as expected, but 1987 looking particularly troublesome.
Marques Johnson:
Known as one of the strongest defenders of the group, his opponents' PPG did indeed dip by nearly a point, though he still gave up an edge in scoring. The totals are perhaps the most skewed against him than anyone, as Johnson's best years statistically came when most rebound, assist and TS game logs were unavailable. His last few seasons with the Clippers drag down his winning percentage from an otherwise quite respectable showing considering he was most often facing Bird and Erving.
Bernard King:
A tale of really three careers here, as his stints with New Jersey and Golden State saw bad to ho hum team success but general edges in scoring for King, his 83-85 NYK glory years saw a growing scoring gap but further poor team results, and his post-injury career saw King generally losing the scoring and efficiency battle handily and similar poor team success. The .389 winning percentage is the worst of all 9 players. It's just a shame that his knee injury kept us from seeing if he could become even more special.
Dominique Wilkins:
Nique had a predictable scoring edge of nearly 3 PPG (though interestingly both his scoring AND his opponents' scoring was down over a point on season averages) on an equally predictable efficiency deficit of nearly 4% TS. The rebounding and assist stats are more relevant here as they encompass a larger part of his career, and the rebounding advantage and assist deficit that is shown is also largely expected. His teams were outperformed to the tune of over a point per game based on SRS expectations (worst of all 9 players considered here), and only in 1987 and 1991 did they post at least 1 more win than opponents.
James Worthy:
Big Game James has by far the best team success, with the top winning percentage of .672 and the top performance against SRS expectations, with the Lakers exceeding their lofty SRS expectations by nearly a point and a half, on average. He's the only player in the list who wasn't at least arguably the "leader" on the majority of his teams, and his opponents did score more than 4 PPG than he did (though Worthy's scoring increased relative to season averages by over a point while his opponents' scoring decreased by more than a point). Worthy also had a sizable edge in efficiency at nearly +3% TS relative to opponents. Like Nique, most of his games in these comparisons recorded assists and rebounds, so the deficit in both is more meaningful than it would be for others.
A lot of the individual comparisons are interesting:
*Bird 35-33 against Erving, with both players having reduced scoring on greatly reduced efficiency.
*Bird 11-0 vs. Aguirre, including an SRS differential to expectations of +4.72, a scoring margin of nearly 6 PPG on nearly +14 TS%.
*Erving 26-5 vs. King despite a big scoring deficit.
*Dantley with a clear edge over English (roughly +5 PPG, +5 wins on +1.25 SRS differential, +10% TS), who has an edge over Wilkins (+1 PPG, +5 SRS differential, +2% TS), who has an arguable edge over Dantley (+7 PPG but -6% TS). Transitive property be damned!
A full set of spreadsheets with yearly comparisons of each player against all of the others collectively, as well as the 36 individual player vs. player matchups here.
Below I'll post the summaries for each player against all of the others collectively. TS values with asterisks imply that up to half of the games in that season have missing statistics.
The column "Vs. Exp" is a comparison of team margin vs. SRS expectations, taking into account homecourt advantage. Each of the columns labelled "Rel" indicate difference from season averages of the previous column.
Larry Bird:
As expected, Bird enjoyed great team success against the competition, sporting a .605 winning percentage. He outscored his opponents by about a point on TS 2% better than his opponents (since 1982), and had massive advantages in rebounds and assists, as you would expect. Interestingly, both his TS and his opponents' TS dropped by more than 2% from their respective averages.
Code: Select all
Player   Year    W   L Vs. Exp  PPG    Rel   RPG   Rel   APG   Rel    TS      Rel
Bird     1980   11   7  -0.62  22.78  +1.50   NA    NA    NA    NA     NA      NA
Top SFs  1980    7  11  +0.62  26.00  +1.85   NA    NA    NA    NA     NA      NA
Bird     1981   14  10  -0.08  23.13  +1.89   NA    NA    NA    NA     NA      NA
Top SFs  1981   10  14  +0.08  24.38  +0.49   NA    NA    NA    NA     NA      NA
Bird     1982   13   9  +2.22  21.09  -1.78   NA    NA    NA    NA   .4644* -.0925
Top SFs  1982    9  13  -2.22  22.18  -1.34   NA    NA    NA    NA   .5470* -.0425
Bird     1983   19  13  +1.60  23.38  -0.26   NA    NA    NA    NA   .5412  -.0194
Top SFs  1983   13  19  -1.60  20.19  -1.11   NA    NA    NA    NA   .5145  -.0361
Bird     1984   29  18  -0.97  24.49  +0.34   NA    NA    NA    NA   .5533  +.0010
Top SFs  1984   18  29  +0.97  23.04  +0.97   NA    NA    NA    NA   .5511  -.0253
Bird     1985   23  11  +0.51  27.29  -1.39   NA    NA    NA    NA   .5731  -.0121
Top SFs  1985   11  23  -0.51  22.97  +0.14   NA    NA    NA    NA   .5265  -.0320
Bird     1986   22   4  +0.57  25.54  -0.25  9.88 +0.07  7.23 +0.44  .5735  -.0068
Top SFs  1986    4  22  -0.57  25.19  -0.38  5.54 -0.81  3.38 +0.25  .5349  -.0196
Bird     1987   18  15  -0.98  26.09  -1.96  9.30 +0.09  7.64 -0.01  .5831  -.0285
Top SFs  1987   15  18  +0.98  23.97  +1.81  4.24 -0.79  3.03 +0.23  .5638  -.0058
Bird     1988   19  16  -1.11  26.34  -3.59  8.89 -0.36  6.06 -0.09  .5722  -.0356
Top SFs  1988   16  19  +1.11  22.43  -1.41  4.11 -0.67  2.66 -0.27  .5297  -.0287
Bird     1989    0   1  -9.61  24.00  +4.67 10.00 +3.83  6.00 +1.17  .6682  +.1520
Top SFs  1989    1   0  +9.61  31.00 +12.62  4.00 +0.10  5.00 +2.79  .7033  +.0898
Bird     1990    5   7  -1.44  23.92  -0.35 10.58 +1.09  6.50 -0.99  .5383  -.0072
Top SFs  1990    7   5  +1.44  21.92  -0.95  3.25 -2.15  2.92 -0.51  .5119  -.0398
Bird     1991    4   3  +1.16  15.29  -4.11  7.86 -0.63  7.71 +0.53  .4646  -.0657
Top SFs  1991    3   4  -1.16  20.14  -5.85  5.71 -1.53  2.29 -1.39  .5029  -.0390
Bird     1992    1   2  -8.98  16.67  -3.51  7.67 -1.98  6.00 -0.80  .4941  -.0534
Top SFs  1992    2   1  +8.98  28.00  +2.65  5.67 -0.90  4.00 -0.06  .5271  -.0032
Bird     Total 178 116  -0.15  24.39  -0.82  9.32 -0.01  6.91 -0.01  .5560  -.0209
Top SFs  Total 116 178  +0.15  23.13  -0.00  4.51 -0.94  2.98 -0.07  .5368  -.0260
Julius Erving:
I was a little surprised that Dr. J ended up on the wrong end of the scoring comparison on nearly identical efficiency to his opponents. Still, the bulk of the data came as he was winding down his career, with rebounding, assist and TS stats only available from 1982 onward. Still, his teams enjoyed the third best winning percentage among the 9 players considered here.
Code: Select all
Player   Year    W   L Vs. Exp  PPG    Rel  RPG   Rel   APG   Rel     TS    Rel
Erving   1977    1   2  -9.35  14.67 -6.92   NA    NA    NA    NA     NA     NA
Top SFs  1977    2   1  +9.35  19.00 -1.31   NA    NA    NA    NA     NA     NA
Erving   1978    6   4  +0.25  19.40 -1.25   NA    NA    NA    NA     NA     NA
Top SFs  1978    4   6  -0.25  23.40 +1.84   NA    NA    NA    NA     NA     NA
Erving   1979    8   7  -2.90  23.07 -0.05   NA    NA    NA    NA     NA     NA
Top SFs  1979    7   8  +2.90  22.07 +1.73   NA    NA    NA    NA     NA     NA
Erving   1980   13   5  +1.89  27.17 +0.24   NA    NA    NA    NA     NA     NA
Top SFs  1980    5  13  -1.89  21.06 +0.04   NA    NA    NA    NA     NA     NA
Erving   1981   17  14  -0.49  23.94 -0.63   NA    NA    NA    NA     NA     NA
Top SFs  1981   14  17  +0.49  26.06 +4.39   NA    NA    NA    NA     NA     NA
Erving   1982   16  14  -0.05  23.10 -1.27  7.33 +0.46  4.83 +0.90  .5964 +.0037
Top SFs  1982   14  16  +0.05  19.53 -1.69  9.37 +1.16  4.53 -0.14  .5095 -.0620
Erving   1983   24   7  +2.10  19.61 -1.80  7.29 +0.47  3.48 -0.17  .5339 -.0324
Top SFs  1983    7  24  -2.10  21.81 -0.11  7.42 +0.62  3.39 -0.38  .5231 -.0274
Erving   1984   16  13  +1.28  21.48 -0.95  7.21 +0.30  3.86 -0.15  .5331 -.0289
Top SFs  1984   13  16  -1.28  23.69 -0.11  7.17 +0.22  3.79 -0.04  .5300 -.0357
Erving   1985   14  11  +0.67  18.00 -2.01  5.32 +0.01  3.40 +0.41  .5208 -.0248
Top SFs  1985   11  14  -0.67  28.12 +0.68  7.20 -0.67  4.36 -0.25  .5754 +.0039
Erving   1986    8  10  -1.95  16.06 -2.05  5.39 +0.39  4.17 +0.82  .4936 -.0437
Top SFs  1986   10   8  +1.95  25.61 -1.13  8.06 +0.46  5.17 +0.70  .5320 -.0332
Erving   1987    6   9  -2.08  15.27 -1.48  4.80 +0.40  3.93 +0.75  .4688 -.0583
Top SFs  1987    9   6  +2.08  23.60 -1.60  5.47 -0.83  5.33 +0.88  .5385 -.0426
Erving   Total 129  96  +0.00  20.92 -1.24  6.47 +0.34  3.95 +0.36  .5348 -.0262
Top SFs  Total  96 129  -0.00  23.45 +0.41  7.61 +0.27  4.28 +0.02  .5347 -.0316
Mark Aguirre:
Aguirre has a scoring edge over his opponents on slightly worse efficiency, and is neck and neck in both rebounding and assists since 1986. His teams didn't do so hot, though, with a 0.437 winning percentage (only posting winning records against these opponents twice) and an average performance of 0.52 points worse than SRS expectations.
Code: Select all
Player   Year    W   L Vs. Exp  PPG    Rel  RPG   Rel   APG    Rel     TS     Rel
Aguirre  1982    3   9  -0.04  24.58 +5.86   NA   NA     NA    NA     NA      NA
Top SFs  1982    9   3  +0.04  28.75 +1.85   NA   NA     NA    NA     NA      NA
Aguirre  1983    4  12  -1.87  26.31 +1.88   NA   NA     NA    NA   .5322* -.0032
Top SFs  1983   12   4  +1.87  25.56 +1.14   NA   NA     NA    NA   .5580* +.0018
Aguirre  1984   13  17  -0.57  27.73 -1.76   NA   NA     NA    NA   .5587  -.0129
Top SFs  1984   17  13  +0.57  23.67 +1.66   NA   NA     NA    NA   .5964  +.0093
Aguirre  1985   10  16  -4.23  27.54 +1.85   NA   NA     NA    NA   .5681  +.0048
Top SFs  1985   16  10  +4.23  21.77 -1.79   NA   NA     NA    NA   .5408  -.0209
Aguirre  1986   13  17  -0.11  21.43 -1.13  5.73 -0.28  4.77 +0.19  .5205  -.0269
Top SFs  1986   17  13  +0.11  23.00 -1.08  5.60 +0.07  3.70 +0.31  .5699  -.0123
Aguirre  1987   10   9  -0.01  26.84 +1.14  4.26 -1.07  2.84 -0.33  .5651  +.0049
Top SFs  1987    9  10  +0.01  23.11 -1.06  6.26 +1.04  3.37 -0.64  .5435  -.0175
Aguirre  1988   13  17  +0.41  25.00 -0.09  5.63 -0.00  3.60 -0.01  .5541  +.0152
Top SFs  1988   17  13  -0.41  23.73 +0.82  4.97 -0.11  4.33 +0.24  .5511  -.0063
Aguirre  1989   14   6  +2.70  15.55 -2.41  4.55 -0.10  3.70 +0.50  .5239  -.0026
Top SFs  1989    6  14  -2.70  18.50 -4.26  4.05 -1.25  3.45 -0.14  .4933  -.0592
Aguirre  Total  80 103  -0.52  24.47 +0.18  5.18 -0.31  3.83 +0.09  .5487  -.0033
Top SFs  Total 103  80  +0.52  23.17 -0.38  5.22 -0.07  3.78 +0.02  .5541  -.0131
Adrian Dantley:
As you might expect, Dantley has the largest scoring margin of the 9 players considered here, outgunning his opponents by over 3 PPG on nearly 8% better TS. Team success in Utah was predictably poor (particularly 1985 and 1986), though not relative to SRS expectations. In fact, his teams tended to outperform their SRS expectations against this set of opponents. Most surprising may be that his opponents' scoring average was more than a point less than their respective season averages overall, and while his time in Detroit did contribute to that, his opponents weren't going crazy on him in Utah, even prior to the Jazz becoming good on defense in 1983. He loses out on rebounds and assists, though I imagine this is somewhat distorted by the fact the data is mostly available after he assumed a reduced role in Detroit and Dallas.
Code: Select all
Player   Year    W   L Vs. Exp  PPG    Rel  RPG   Rel   APG   Rel     TS     Rel
Dantley  1977    2   1  +9.35  19.00 -1.31   NA    NA    NA    NA     NA      NA
Top SFs  1977    1   2  -9.35  14.67 -6.92   NA    NA    NA    NA     NA      NA
Dantley  1978    8   3  +0.86  21.64 +0.29   NA    NA    NA    NA     NA      NA
Top SFs  1978    3   8  -0.86  18.82 -2.47   NA    NA    NA    NA     NA      NA
Dantley  1979    9   4  +3.69  20.92 +3.59   NA    NA    NA    NA     NA      NA
Top SFs  1979    4   9  -3.69  18.08 -2.96   NA    NA    NA    NA     NA      NA
Dantley  1980    4   7  +0.88  27.82 -0.17   NA    NA    NA    NA     NA      NA
Top SFs  1980    7   4  -0.88  21.91 +0.57   NA    NA    NA    NA     NA      NA
Dantley  1981    6  10  +3.14  34.69 +4.04   NA    NA    NA    NA     NA      NA
Top SFs  1981   10   6  -3.14  21.44 -1.22   NA    NA    NA    NA     NA      NA
Dantley  1982    8  14  +0.36  33.36 +3.03   NA    NA    NA    NA     NA      NA
Top SFs  1982   14   8  -0.36  23.45 +1.21   NA    NA    NA    NA     NA      NA
Dantley  1983    2   3  -4.60  32.40 +1.67   NA    NA    NA    NA   .7066* +.0453
Top SFs  1983    3   2  +4.60  26.80 +2.86   NA    NA    NA    NA   .5618* +.0052
Dantley  1984   12  18  -2.63  31.13 +0.53   NA    NA    NA    NA   .6495  -.0025
Top SFs  1984   18  12  +2.63  24.07 +0.17   NA    NA    NA    NA   .5593  -.0108
Dantley  1985    8  16  +0.45  25.21 -1.37   NA    NA    NA    NA   .6092  +.0019
Top SFs  1985   16   8  -0.45  24.42 -0.32   NA    NA    NA    NA   .5601  +.0019
Dantley  1986    5  17  -0.68  29.18 -0.65  6.00 +0.80  3.82 +0.34  .6256  -.0030
Top SFs  1986   17   5  +0.68  20.95 -2.28  5.82 -0.09  3.73 -0.20  .5434  -.0221
Dantley  1987   18  13  +5.17  20.68 -0.83  4.29 +0.19  2.03 +0.03  .6055  -.0087
Top SFs  1987   13  18  -5.17  24.29 -1.57  7.03 +0.35  4.52 -0.24  .5360  -.0313
Dantley  1988   19  17  +0.08  20.00 +0.00  3.69 +0.40  2.06 -0.42  .6187  -.0003
Top SFs  1988   17  19  -0.08  22.00 -2.38  6.94 +0.56  4.36 +0.06  .5432  -.0284
Dantley  1989   11   6  +5.00  19.53 +0.38  3.71 -0.62  1.82 -0.52  .6050  +.0243
Top SFs  1989    6  11  -5.00  21.00 -1.63  6.12 +0.51  3.00 -0.49  .5164  -.0211
Dantley  1990    3   4  +1.63  18.57 +3.86  4.29 +0.46  1.00 -0.78  .6088  +.0532
Top SFs  1990    4   3  -1.63  20.29 -1.07  5.43 +0.36  4.43 +0.93  .5136  -.0382
Dantley  Total 115 133  +1.24  25.52 +0.64  4.35 +0.27  2.29 -0.18  .6245  +.0033
Top SFs  Total 133 115  -1.24  22.31 -1.13  6.53 +0.36  4.08 -0.10  .5458  -.0179
Alex English:
English's scoring is right on par with that of his opponents, but on 5% worse efficiency. I imagine a lot of that can be chalked up to Denver's poor team defense throughout his time there. Like Erving and Dantley, his rebounding and playmaking abilities are probably undersold by the totals, although he enjoys an edge in assists even in his later years. Team success was quite variable, with 1985 shining as expected, but 1987 looking particularly troublesome.
Code: Select all
Player   Year    W   L Vs. Exp  PPG    Rel  RPG   Rel   APG   Rel     TS    Rel
English  1979    5  10  +0.29  14.80 -1.24   NA    NA    NA    NA     NA     NA
Top SFs  1979   10   5  -0.29  21.27 -0.66   NA    NA    NA    NA     NA     NA
English  1980    2  10  -1.80  13.17 -2.83   NA    NA    NA    NA     NA     NA
Top SFs  1980   10   2  +1.80  23.75 -0.60   NA    NA    NA    NA     NA     NA
English  1981    7  10  -0.87  22.00 -1.81   NA    NA    NA    NA     NA     NA
Top SFs  1981   10   7  +0.87  29.82 +4.80   NA    NA    NA    NA     NA     NA
English  1982   12   9  -1.04  26.14 +0.75   NA    NA    NA    NA     NA     NA
Top SFs  1982    9  12  +1.04  30.43 +6.60   NA    NA    NA    NA     NA     NA
English  1983    6  10  +0.08  27.94 -0.43   NA    NA    NA    NA   .5331 -.0281
Top SFs  1983   10   6  -0.08  24.56 +1.62   NA    NA    NA    NA   .5754 +.0232
English  1984   13  19  +0.44  26.88 +0.45   NA    NA    NA    NA   .5713 +.0016
Top SFs  1984   19  13  -0.44  27.63 +2.11   NA    NA    NA    NA   .6273 +.0274
English  1985   22  16  +0.26  27.92 -0.00   NA    NA    NA    NA   .5743 +.0131
Top SFs  1985   16  22  -0.26  22.47 -0.48   NA    NA    NA    NA   .5983 +.0273
English  1986   14  10  +2.42  28.63 -1.18  4.63 -0.38  4.13 +0.17  .5399 -.0218
Top SFs  1986   10  14  -2.42  23.04 -0.47  7.00 +0.96  3.63 -0.18  .5722 -.0059
English  1987    2  18  -8.07  27.35 -1.25  3.80 -0.40  3.80 -1.35  .5493 -.0001
Top SFs  1987   18   2  +8.07  25.05 +2.27  5.45 -0.14  3.65 +0.52  .6394 +.0701
English  1988   13  10  -0.80  26.00 +1.00  4.78 +0.12  4.61 -0.10  .5374 +.0028
Top SFs  1988   10  13  +0.80  22.13 -1.81  5.74 +0.17  3.52 -0.12  .5757 +.0187
English  1989    6   8  -2.06  23.79 -2.74  4.29 +0.31  4.86 +0.19  .4797 -.0514
Top SFs  1989    8   6  +2.06  24.07 +3.65  6.14 +0.80  4.64 +1.29  .5658 +.0204
English  1990    4   8  -2.26  16.00 -1.91  3.25 -0.33  2.92 +0.10  .4737 -.0480
Top SFs  1990    8   4  +2.26  21.83 +0.13  8.17 +2.05  4.08 +0.16  .5944 +.0349
English  Total 106 138  -0.85  24.70 -0.62  4.26 -0.15  4.13 -0.23  .5458 -.0082
Top SFs  Total 138 106  +0.85  24.77 +1.33  6.38 +0.65  3.82 +0.25  .5982 +.0269
Marques Johnson:
Known as one of the strongest defenders of the group, his opponents' PPG did indeed dip by nearly a point, though he still gave up an edge in scoring. The totals are perhaps the most skewed against him than anyone, as Johnson's best years statistically came when most rebound, assist and TS game logs were unavailable. His last few seasons with the Clippers drag down his winning percentage from an otherwise quite respectable showing considering he was most often facing Bird and Erving.
Code: Select all
Player   Year    W   L Vs. Exp  PPG    Rel  RPG   Rel   APG   Rel    TS    Rel
Johnson  1978    5   4  +2.01  21.11 +1.65   NA    NA    NA    NA    NA     NA
Top SFs  1978    4   5  -2.01  26.56 +3.97   NA    NA    NA    NA    NA     NA
Johnson  1979    7   7  -3.52  22.57 -3.04   NA    NA    NA    NA    NA     NA
Top SFs  1979    7   7  +3.52  19.86 +0.44   NA    NA    NA    NA    NA     NA
Johnson  1980    5   6  -0.99  23.18 +1.48   NA    NA    NA    NA    NA     NA
Top SFs  1980    6   5  +0.99  22.27 -1.93   NA    NA    NA    NA    NA     NA
Johnson  1981   12  11  -1.42  22.78 +2.51   NA    NA    NA    NA    NA     NA
Top SFs  1981   11  12  +1.42  23.83 -0.24   NA    NA    NA    NA    NA     NA
Johnson  1982   11   9  +0.18  16.35 -0.15   NA    NA    NA    NA  .4947 -.0714
Top SFs  1982    9  11  -0.18  23.00 -1.71   NA    NA    NA    NA  .5837 -.0044
Johnson  1983   19  12  +1.57  21.00 -0.43   NA    NA    NA    NA  .5231 -.0200
Top SFs  1983   12  19  -1.57  19.81 -2.56   NA    NA    NA    NA  .5102 -.0494
Johnson  1984   17  21  -2.14  21.84 +1.10   NA    NA    NA    NA  .5456 +.0117
Top SFs  1984   21  17  +2.14  21.82 -1.90   NA    NA    NA    NA  .5530 -.0114
Johnson  1985    8  14  +1.71  16.86 +0.46   NA    NA    NA    NA  .5155 +.0268
Top SFs  1985   14   8  -1.71  24.86 -0.04   NA    NA    NA    NA  .5523 -.0220
Johnson  1986    8  16  +0.82  20.54 +0.21  5.38 -0.17  3.25 -0.52 .5655 +.0104
Top SFs  1986   16   8  -0.82  25.75 +0.68  6.13 +0.20  4.67 +0.86 .5749 -.0017
Johnson  1987    0   3  -3.65  14.67 -1.93  3.00 -0.30  2.67 -0.13 .5584 +.0799
Top SFs  1987    3   0  +3.65  24.67 +1.95  6.33 +1.31  5.33 +2.16 .5964 +.0463
Johnson  Total  92 103  -0.30  20.52 +0.42  5.11 -0.19  3.19 -0.48 .5346 -.0008
Top SFs  Total 103  92  +0.30  22.83 -0.77  6.15 +0.33  4.74 +1.00 .5514 -.0180
Bernard King:
A tale of really three careers here, as his stints with New Jersey and Golden State saw bad to ho hum team success but general edges in scoring for King, his 83-85 NYK glory years saw a growing scoring gap but further poor team results, and his post-injury career saw King generally losing the scoring and efficiency battle handily and similar poor team success. The .389 winning percentage is the worst of all 9 players. It's just a shame that his knee injury kept us from seeing if he could become even more special.
Code: Select all
Player   Year    W   L Vs. Exp  PPG    Rel  RPG   Rel   APG   Rel     TS    Rel
King     1978    1   9  -3.02  26.60 +2.44   NA    NA    NA    NA     NA     NA
Top SFs  1978    9   1  +3.02  20.80 +0.29   NA    NA    NA    NA     NA     NA
King     1979    8   9  +2.38  19.29 -2.28   NA    NA    NA    NA     NA     NA
Top SFs  1979    9   8  -2.38  18.88 -2.21   NA    NA    NA    NA     NA     NA
King     1981    7   8  +0.97  26.60 +4.74   NA    NA    NA    NA     NA     NA
Top SFs  1981    8   7  -0.97  23.87 -1.05   NA    NA    NA    NA     NA     NA
King     1982    9   8  -2.16  23.53 +0.33   NA    NA    NA    NA     NA     NA
Top SFs  1982    8   9  +2.16  25.18 +0.30   NA    NA    NA    NA     NA     NA
King     1983    9  18  -1.11  21.26 -0.59   NA    NA    NA    NA   .5553 -.0107
Top SFs  1983   18   9  +1.11  18.56 -3.26   NA    NA    NA    NA   .5160 -.0419
King     1984   15  18  +0.05  26.45 +0.13   NA    NA    NA    NA   .6045 -.0143
Top SFs  1984   18  15  -0.05  24.06 +0.87   NA    NA    NA    NA   .5833 +.0243
King     1985    5  12  +3.31  30.35 -2.54   NA    NA    NA    NA   .5386 -.0465
Top SFs  1985   12   5  -3.31  22.76 -1.28   NA    NA    NA    NA   .5617 +.0048
King     1987    0   3  -0.33  23.00 +0.33  5.33 +0.00  3.00 -0.17  .5777 +.0290
Top SFs  1987    3   0  +0.33  28.33 +4.64  4.00 -1.80  3.33 -0.55  .6742 +.0615
King     1988    9  14  +1.44  13.30 -3.91  2.74 -1.32  2.48 -0.30  .5248 -.0249
Top SFs  1988   14   9  -1.44  28.04 +2.69  5.83 +0.16  3.52 -0.19  .5835 +.0062
King     1989    4  11  -1.70  19.73 -0.93  4.40 -0.34  4.47 +0.84  .5232 -.0116
Top SFs  1989   11   4  +1.70  27.60 +6.09  5.53 +0.34  3.40 +0.47  .6159 +.0634
King     1990    8   6  +1.28  20.00 -2.40  4.21 -0.71  3.29 -1.30  .5598 +.0146
Top SFs  1990    6   8  -1.28  21.07 -1.17  6.29 -0.20  3.93 -0.10  .4974 -.0567
King     1991    2   5  -1.26  20.71 -7.68  3.86 -1.13  4.00 -0.56  .4679 -.0590
Top SFs  1991    5   2  +1.26  20.14 -2.63  7.00 -0.60  4.57 +0.11  .4782 -.0648
King     Total  77 121  +0.16  22.48 -0.92  3.73 -0.86  3.34 -0.28  .5558 -.0184
Top SFs  Total 121  77  -0.16  23.12 +0.03  5.90 -0.06  3.69 +0.01  .5630 +.0015
Dominique Wilkins:
Nique had a predictable scoring edge of nearly 3 PPG (though interestingly both his scoring AND his opponents' scoring was down over a point on season averages) on an equally predictable efficiency deficit of nearly 4% TS. The rebounding and assist stats are more relevant here as they encompass a larger part of his career, and the rebounding advantage and assist deficit that is shown is also largely expected. His teams were outperformed to the tune of over a point per game based on SRS expectations (worst of all 9 players considered here), and only in 1987 and 1991 did they post at least 1 more win than opponents.
Code: Select all
Player   Year    W   L Vs. Exp  PPG    Rel  RPG   Rel   APG   Rel     TS    Rel
Wilkins  1983   10  18  -2.96  15.32 -2.17   NA    NA    NA    NA   .4727 -.0513
Top SFs  1983   18  10  +2.96  23.82 +0.90   NA    NA    NA    NA   .5561 -.0011
Wilkins  1984   15  17  +1.62  20.75 -0.85   NA    NA    NA    NA   .5029 -.0283
Top SFs  1984   17  15  -1.62  22.19 -1.24   NA    NA    NA    NA   .5608 -.0102
Wilkins  1985    3  15  -2.60  28.78 +1.41   NA    NA    NA    NA   .5187 +.0046
Top SFs  1985   15   3  +2.60  28.61 +3.00   NA    NA    NA    NA   .5671 -.0053
Wilkins  1986    9  15  -2.06  28.96 -1.38  7.25 -0.67  3.00 +0.36  .5295 -.0064
Top SFs  1986   15   9  +2.06  23.38 -0.35  6.42 -0.94  4.67 -0.43  .5672 -.0041
Wilkins  1987   14  10  -1.40  28.50 -0.54  6.25 -0.00  3.25 -0.05  .5258 -.0169
Top SFs  1987   10  14  +1.40  22.04 -1.28  5.63 -0.03  4.08 +0.10  .5557 -.0333
Wilkins  1988   11  16  -1.15  29.63 -1.10  6.11 -0.32  2.33 -0.54  .5190 -.0148
Top SFs  1988   16  11  +1.15  19.96 -4.66  4.78 -1.70  3.78 -0.74  .5525 -.0331
Wilkins  1989    6   9  -3.80  25.07 -1.17  7.00 +0.09  2.33 -0.30  .5368 +.0085
Top SFs  1989    9   6  +3.80  15.80 -3.97  3.93 -0.69  2.93 -0.19  .5307 -.0275
Wilkins  1990    4   9  -0.16  23.23 -3.49  5.08 -1.44  2.15 -0.35  .5294 -.0267
Top SFs  1990    9   4  +0.16  20.54 -0.95  6.00 -0.20  4.00 -0.84  .6291 +.0799
Wilkins  1991    5   3  +3.92  24.13 -1.81  7.50 -1.54  2.63 -0.65  .5538 -.0012
Top SFs  1991    3   5  -3.92  17.75 -5.27  5.00 -1.68  5.63 -0.12  .4939 -.0353
Wilkins  1992    2   1  +7.93  27.00 -1.07  7.33 +0.31  4.33 +0.57  .5335 -.0181
Top SFs  1992    1   2  -7.93  16.00 -4.09  5.00 -3.31  5.00 -1.09  .5017 -.0255
Wilkins  1993    1   1 -15.04  26.00 -3.87  8.50 +1.71  3.00 -0.20  .6366 +.0664
Top SFs  1993    1   1 +15.04  17.50 +2.61  3.50 +0.49  3.50 +0.11  .6034 +.1091
Wilkins  Total  80 114  -1.17  24.71 -1.17  6.54 -0.43  2.72 -0.17  .5192 -.0151
Top SFs  Total 114  80  +1.17  21.91 -1.27  5.32 -0.90  4.09 -0.39  .5590 -.0094
James Worthy:
Big Game James has by far the best team success, with the top winning percentage of .672 and the top performance against SRS expectations, with the Lakers exceeding their lofty SRS expectations by nearly a point and a half, on average. He's the only player in the list who wasn't at least arguably the "leader" on the majority of his teams, and his opponents did score more than 4 PPG than he did (though Worthy's scoring increased relative to season averages by over a point while his opponents' scoring decreased by more than a point). Worthy also had a sizable edge in efficiency at nearly +3% TS relative to opponents. Like Nique, most of his games in these comparisons recorded assists and rebounds, so the deficit in both is more meaningful than it would be for others.
Code: Select all
Player   Year    W   L Vs. Exp  PPG    Rel  RPG   Rel   APG   Rel     TS    Rel
Worthy   1984   24  13  +3.18  15.57 +1.12   NA    NA    NA    NA   .6196 +.0289
Top SFs  1984   13  24  -3.18  24.97 -1.50   NA    NA    NA    NA   .5709 -.0051
Worthy   1985   27   9  +0.23  18.86 +1.24   NA    NA    NA    NA   .6096 +.0090
Top SFs  1985    9  27  -0.23  25.14 -0.74   NA    NA    NA    NA   .5795 +.0176
Worthy   1986   20  10  +0.33  19.83 -0.17  5.23 +0.07  2.57 -0.11  .5950 -.0176
Top SFs  1986   10  20  -0.33  23.63 -1.23  5.83 -0.07  4.37 +0.19  .5537 -.0129
Worthy   1987   19   7  +4.23  21.31 +1.87  5.58 -0.11  3.23 +0.47  .5940 +.0157
Top SFs  1987    7  19  -4.23  23.58 -3.33  5.96 -0.16  3.92 -1.15  .5596 -.0144
Worthy   1988   17  11  +1.43  21.29 +1.58  5.39 +0.41  4.04 +0.18  .5644 -.0063
Top SFs  1988   11  17  -1.43  25.36 +1.27  5.86 +0.77  3.18 -0.36  .5798 +.0188
Worthy   1989    9   9  -1.00  23.67 +3.21  6.50 +0.46  3.72 +0.17  .5560 -.0261
Top SFs  1989    9   9  +1.00  19.56 -1.77  5.28 +0.57  3.50 +0.11  .4992 -.0376
Worthy   1990   11   1  +1.42  21.25 +0.19  7.00 +1.03  4.42 +0.82  .5657 -.0204
Top SFs  1990    1  11  -1.42  18.08 -2.57  5.33 +0.02  2.08 -1.58  .5107 -.0324
Worthy   1991    2   2  -7.67  20.00 -1.41  4.25 -0.31  3.25 -0.28  .4673 -.0639
Top SFs  1991    2   2  +7.67  25.25 -0.28  7.50 +0.63  5.75 +0.86  .5124 -.0233
Worthy   1992    1   1  +1.58  23.50 +3.59  2.50 -3.15  4.00 -0.67  .5293 +.0392
Top SFs  1992    1   1  -1.58  23.00 -1.12  9.00 +0.67  6.00 +0.72  .5300 -.0197
Worthy   1993    1   1 +15.04  17.50 +2.61  3.50 +0.49  3.50 +0.11  .6034 +.1091
Top SFs  1993    1   1 -15.04  26.00 -3.87  8.50 +1.71  3.00 -0.20  .6366 +.0664
Worthy   Total 131  64  +1.47  19.71 +1.23  5.94 +0.19  3.14 +0.16  .5852 -.0005
Top SFs  Total  64 131  -1.47  23.74 -1.25  7.29 +0.86  4.18 -0.39  .5593 -.0038
A lot of the individual comparisons are interesting:
*Bird 35-33 against Erving, with both players having reduced scoring on greatly reduced efficiency.
*Bird 11-0 vs. Aguirre, including an SRS differential to expectations of +4.72, a scoring margin of nearly 6 PPG on nearly +14 TS%.
*Erving 26-5 vs. King despite a big scoring deficit.
*Dantley with a clear edge over English (roughly +5 PPG, +5 wins on +1.25 SRS differential, +10% TS), who has an edge over Wilkins (+1 PPG, +5 SRS differential, +2% TS), who has an arguable edge over Dantley (+7 PPG but -6% TS). Transitive property be damned!